Published: 2026-05-06T06:56:58.000Z
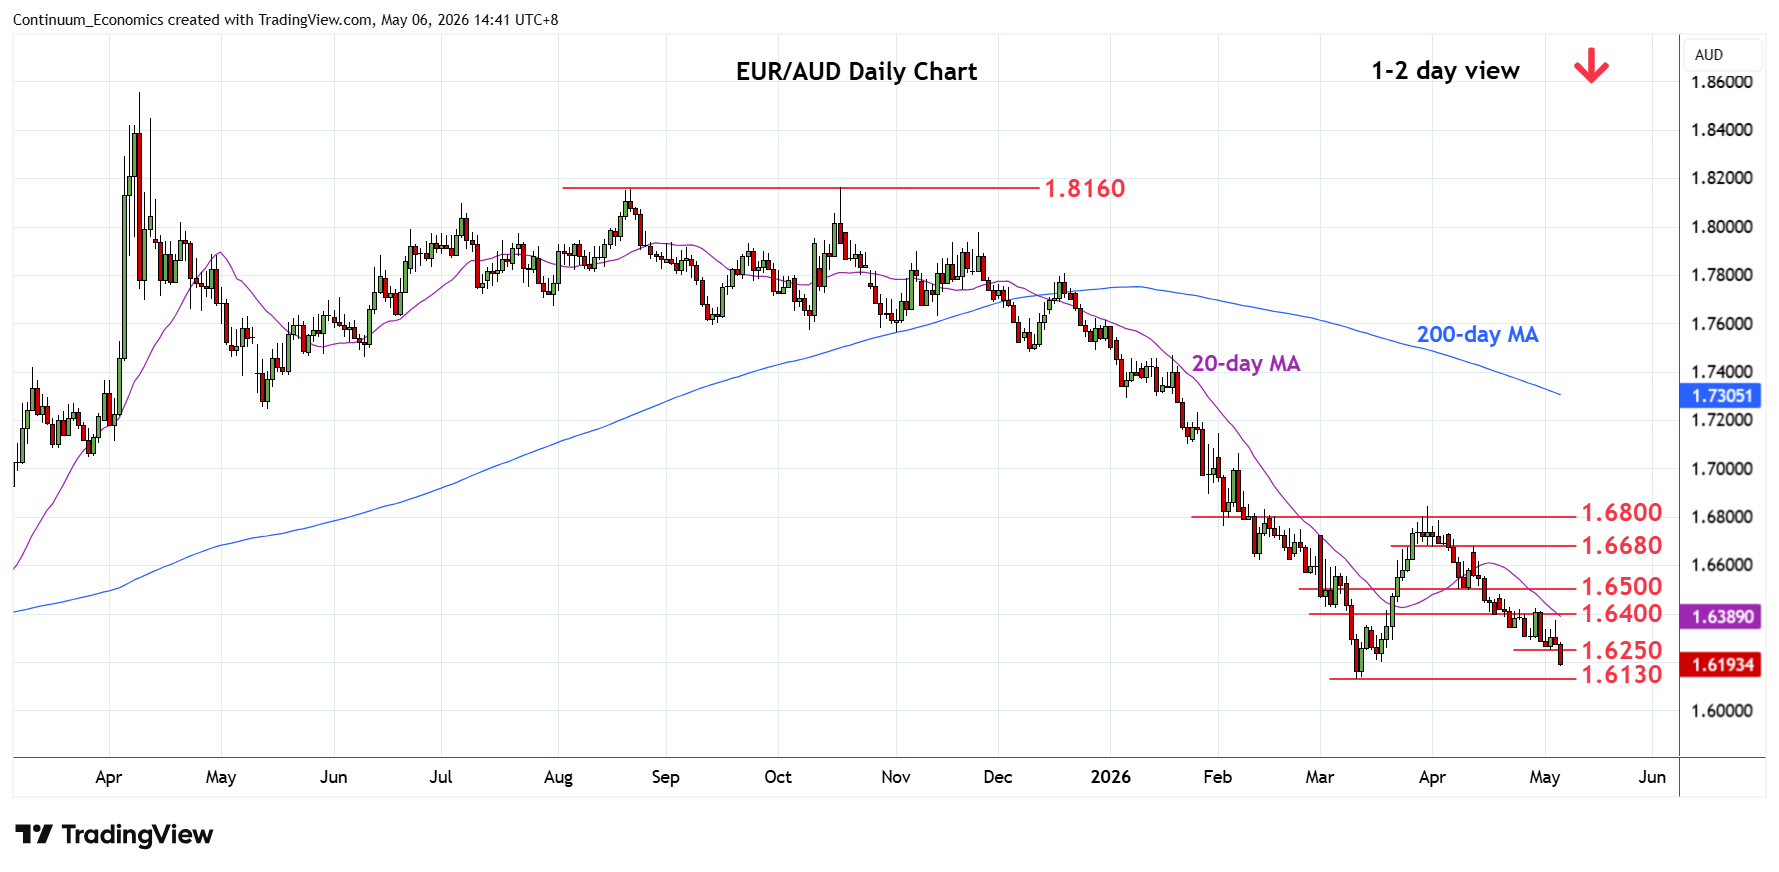
Chart EUR/AUD Update: Under pressure, 1.6130 low at risk
-
Consolidation above the 1.6250 Monday's low has given way to break to extend losses from the 1.6845, March swing high
| Levels | Imp | Comment | Levels | Imp | Comment | |||
|---|---|---|---|---|---|---|---|---|
| R4 | 1.6600/20 | * | congestion | S1 | 1.6200 | * | 18 Mar low | |
| R3 | 1.6500 | ** | congestion, 8 Apr low | S2 | 1.6130 | ** | 11 Mar YTD low | |
| R2 | 1.6400/25 | * | congestion, 5 Mar low | S3 | 1.6000 | ** | figure, congestion | |
| R1 | 1.6250 | * | 4 May low | S4 | 1.5960 | ** | 2024 year low |
Asterisk denotes strength of level
06:50 GMT - Consolidation above the 1.6250 Monday's low has given way to break to extend losses from the 1.6845, March swing high. Below the 1.6200 level expose the 1.6130 March YTD low to retest. Reaction here can be expected but negative daily studies suggest this giving way to break to orrective bounce to retrace losses from the 1.6845 March high. Resistance is at the 1.6400/25 congestion and 5 March low which is expected to further retrace the 2022/2025 rally and see room to the 1.6000 figure. Below this will see room to 1.5960 the 2024 year low and 1.5915, 61.8% Fibonacci retracement.