Published: 2026-01-13T00:30:07.000Z
Chart AUD/USD Update: Higher in consolidation above .6660 support
-
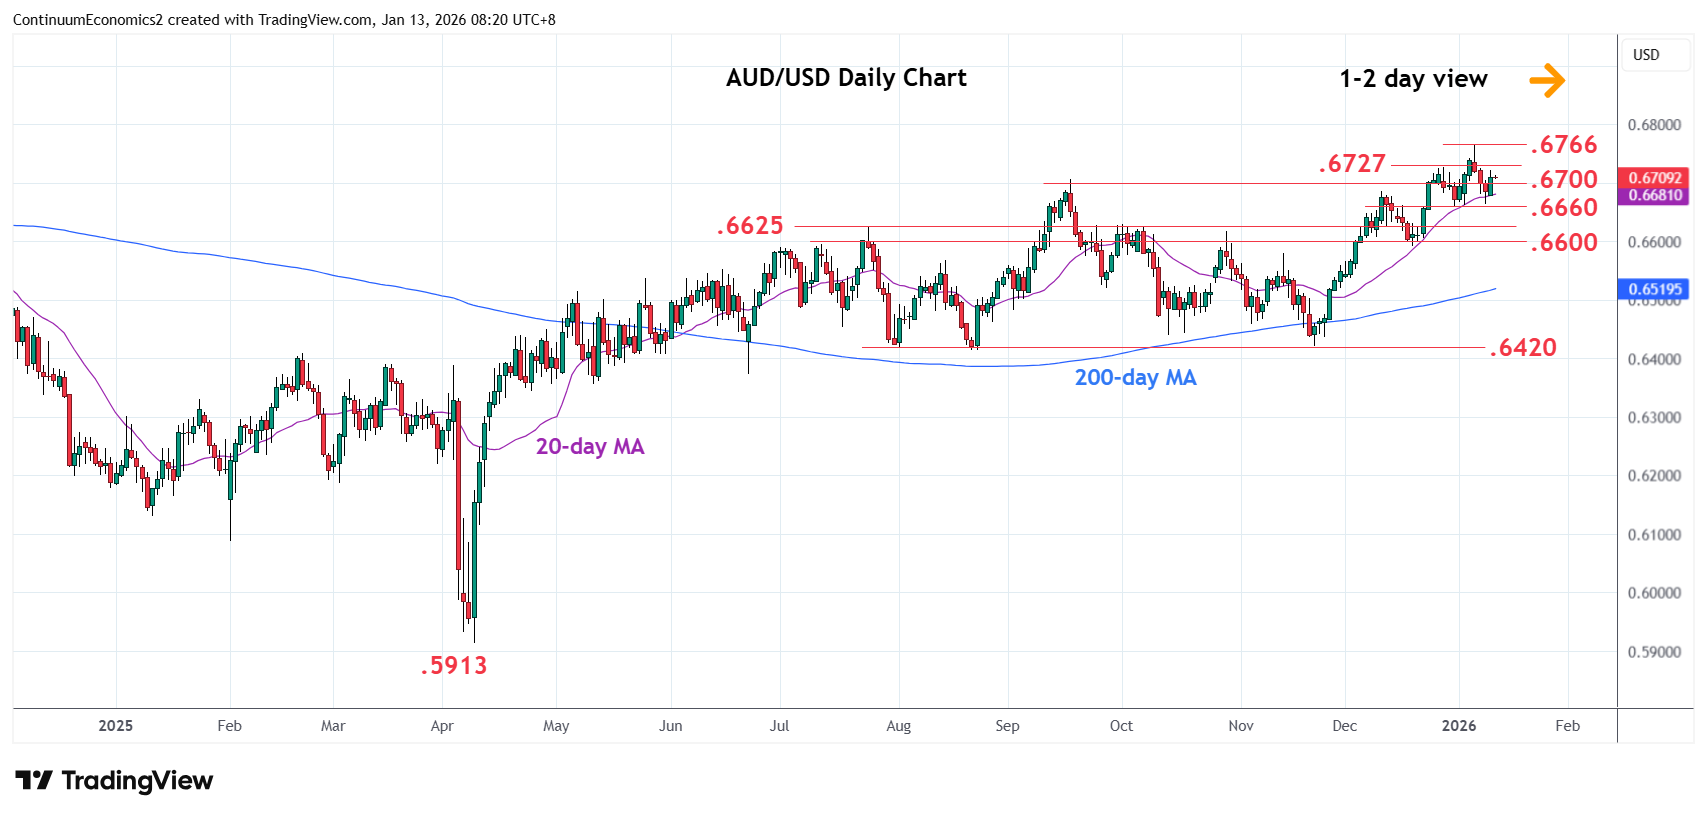
Higher in range from above the .6660 support as prices consolidate losses from the .6766 high of last week
| Levels | Imp | Comment | Levels | Imp | Comment | |||
|---|---|---|---|---|---|---|---|---|
| R4 | 0.6850 | * | congestion | S1 | 0.6660 | ** | 31 Dec low | |
| R3 | 0.680025 | * | congestion, Aug 2024 high | S2 | 0.6625/00 | ** | Jul 2025 high, congestion | |
| R2 | 0.6766 | ** | 7 Jan YTD high | S3 | 0.6550 | * | congestion | |
| R1 | 0.6700/27 | * | congestion, Dec high | S4 | 0.6500 | * | congestion |
Asterisk denotes strength of level
00:15 GMT - Higher in range from above the .6660 support as prices consolidate losses from the .6766 high of last week. Resistance at the .6700/27 area expected to cap and lower sought to further pressure the downside later. Break of the .6660 support will open up room for deeper pullback to retrace gains from the November low and see room for extension to strong support at .6625/.6600 area. Break above resistance at the .6700/27 area, if seen, will expose the .6766 high to retest and see scope for break to extend the April gains.