Chart USD/CAD Update: Corrective bounce
The anticipated test of 1.3600 is extending
| Levels | Imp | Comment | Levels | Imp | Comment | |||
|---|---|---|---|---|---|---|---|---|
| R4 | 1.3850 | congestion | S1 | 1.3600 | * | congestion | ||
| R3 | 1.3800 | ** | congestion | S2 | 1.3500 | ** | congestion | |
| R2 | 1.3725 | * | 5 Feb (w) high | S3 | 1.3480~ | ** | 30 Jan YTD low | |
| R1 | 1.3700 | * | congestion | S4 | 1.3420 | ** | September 2024 low |
Asterisk denotes strength of level
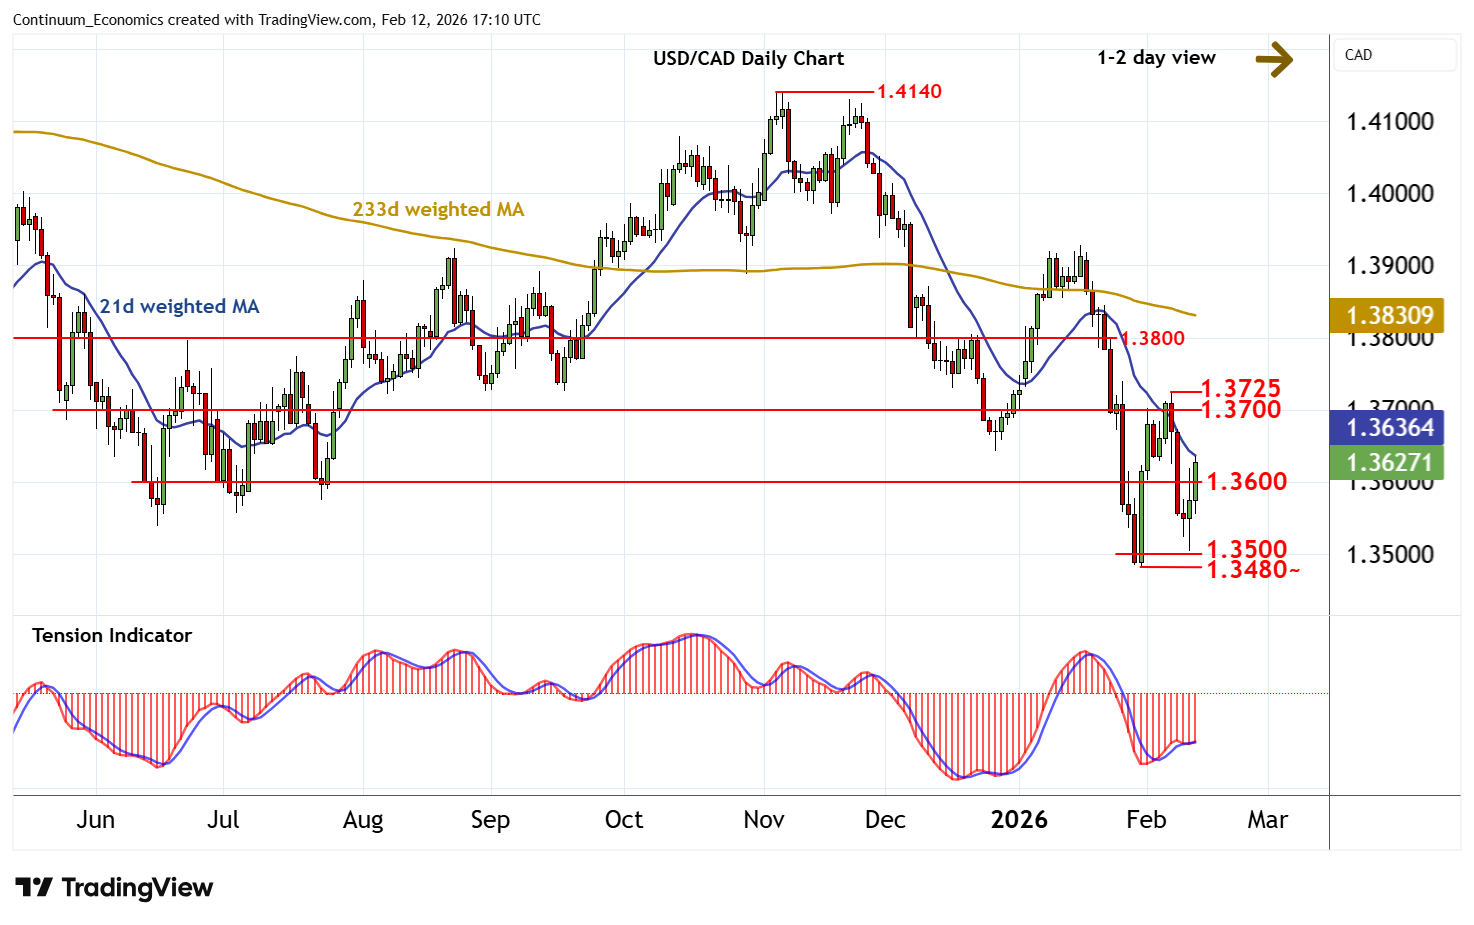
16:50 GMT - The anticipated test of 1.3600 is extending, as intraday studies continue to rise, with prices currently trading around 1.3630. Flat daily stochastics have ticked higher and the daily Tension Indicator continues to rise, highlighting room for continuation towards congestion resistance at 1.3700. Just higher is the 1.3725 weekly high of 5 February. But negative weekly charts should limit any immediate tests of this 1.3700/25 range in consolidation/profit-taking. Following cautious/choppy trade, fresh losses are looked for. A close below the 1.3480~ current year low of 30 January will add weight to sentiment and extend February 2025 losses below the 1.3480~ current year low of 30 January towards the 1.3420 low of September 2024.