Published: 2026-03-03T01:05:51.000Z
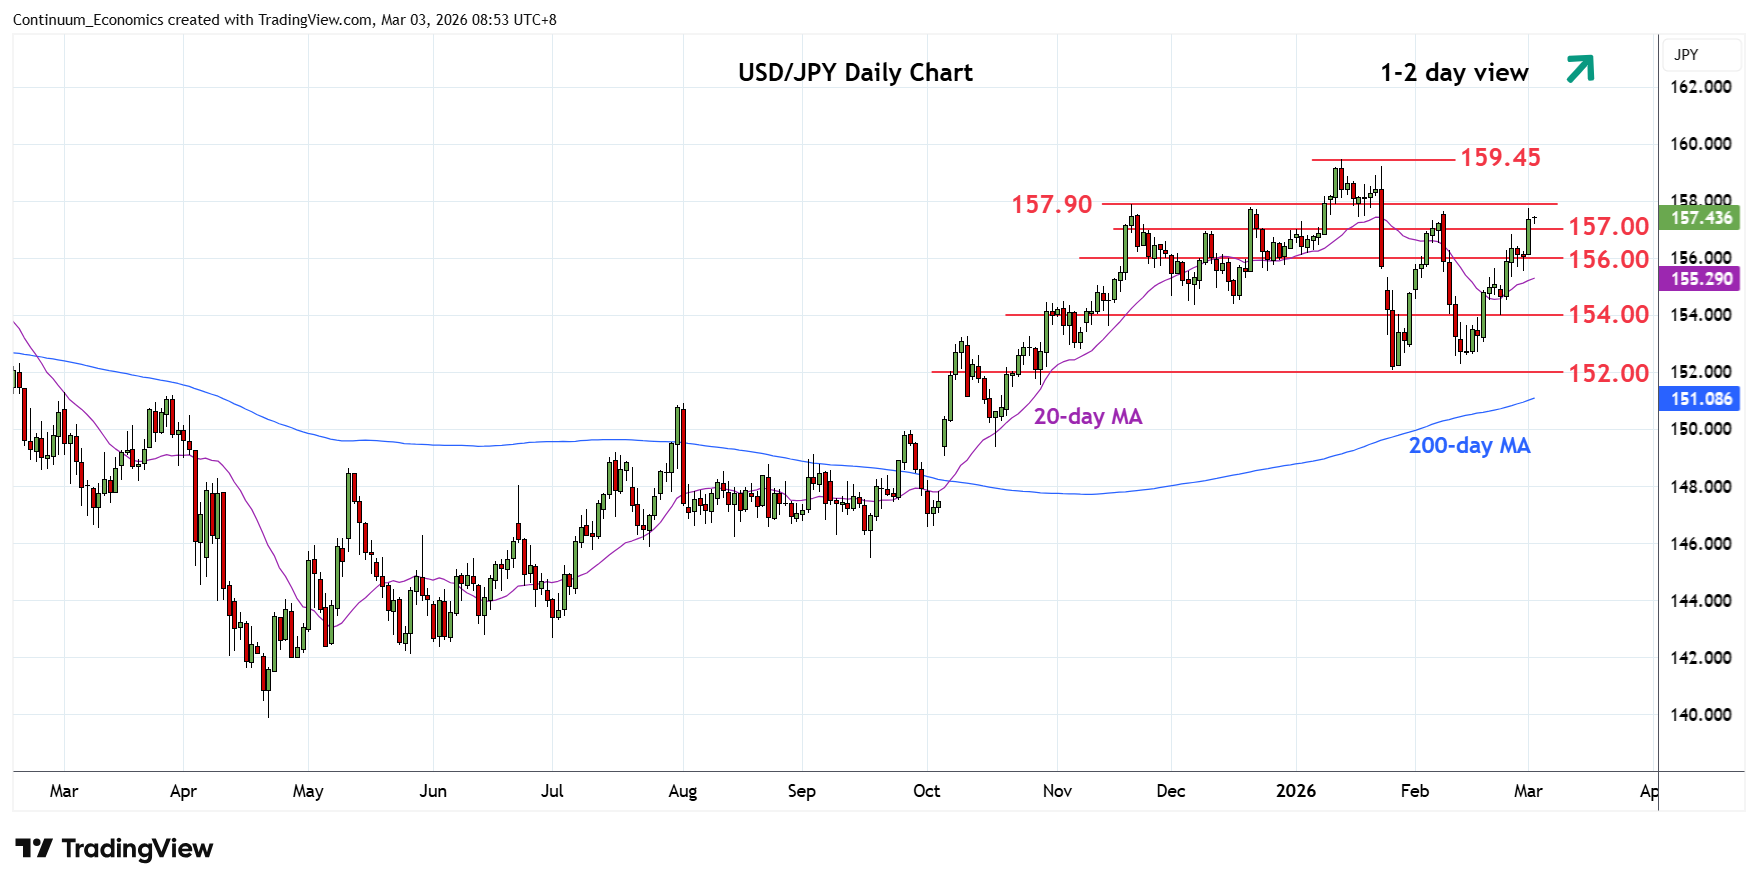
Chart USD/JPY Update: Consolidating test of 157.65/90 resistance
2
Rally to break the 157.00 level further extend the February gains to reach strong resistance at the 157.65/157.90 area
| Levels | Imp | Comment | Levels | Imp | Comment | |||
|---|---|---|---|---|---|---|---|---|
| R4 | 159.45 | ** | 14 Jan YTD high | S1 | 157.00 | * | congestion | |
| R3 | 159.23 | * | 23 Jan high | S2 | 156.00 | * | congestion | |
| R2 | 158.00 | * | congestion | S3 | 155.00 | * | congestion | |
| R1 | 157.65/90 | ** | 9 Feb, Nov highs | S4 | 154.00 | * | 23 Feb low |
Asterisk denotes strength of level
01:00 GMT - Rally to break the 157.00 level further extend the February gains to reach strong resistance at the 157.65/157.90 area. Overbought intraday and daily studies suggest this area expected to limit further gains in consolidation though a later break cannot be ruled out. Clearance will return focus to the 159.23 and 159.45, January highs. Meanwhile, support is raised to the 157.00/156.00 congestion area which should underpin. Would take break here to to fade the upside pressure and open up room for pullback to retrace gains from 152.27/10, February/January lows.