Published: 2025-04-11T13:57:15.000Z
Chart AUD/USD Update: Pressing higher

Senior Technical Strategist
3
The test of 0.6200 has given way to a break higher
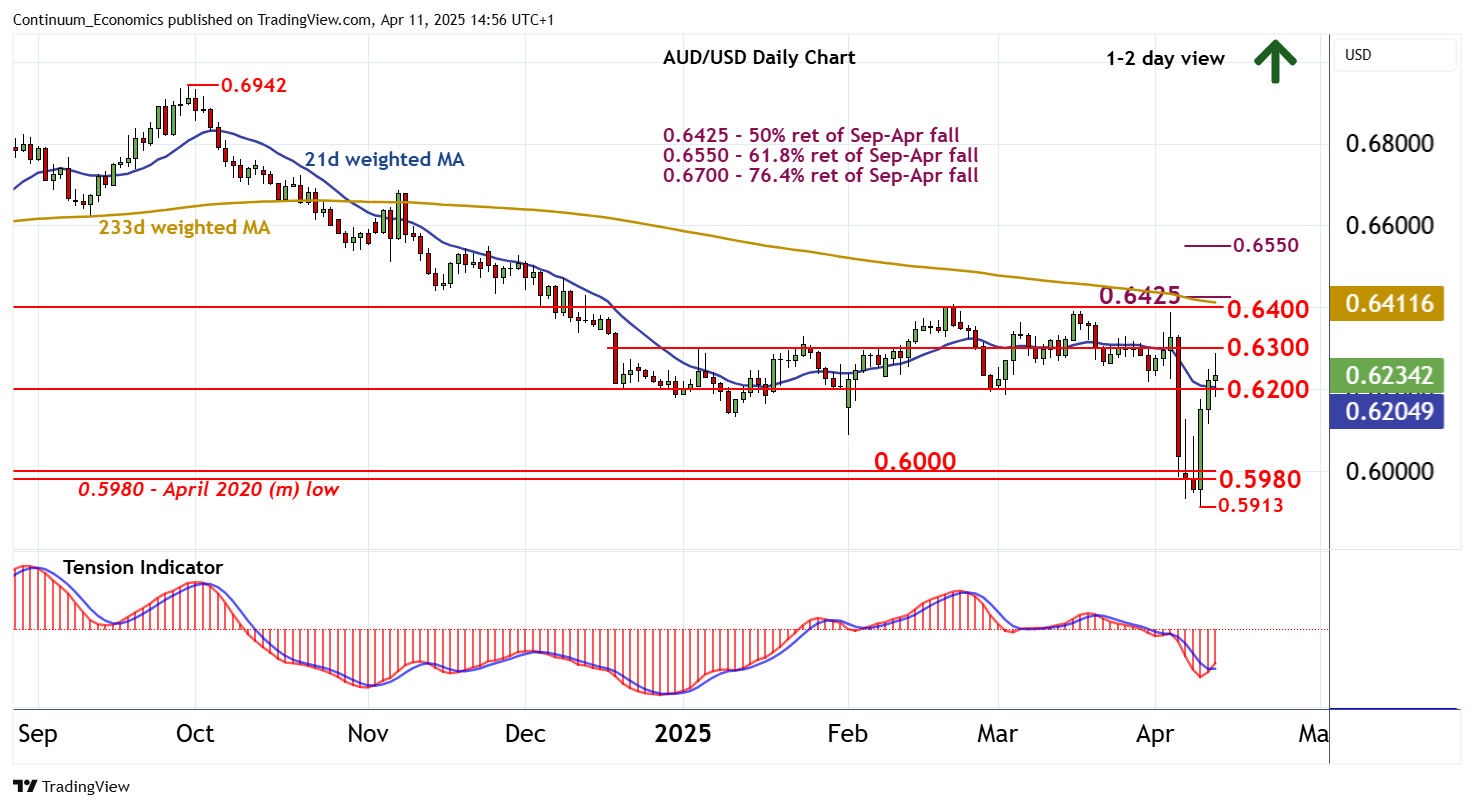
| Levels | Imp | Comment | Levels | Imp | Comment | |||
|---|---|---|---|---|---|---|---|---|
| R4 | 0.6500 | * | congestion | S1 | 0.6200 | ** | congestion | |
| R3 | 0.6425 | ** | 50% ret of Sep-Apr fall | S2 | 0.6000 | ** | historic congestion | |
| R2 | 0.6400 | ** | break level | S3 | 0.5913 | * | 9 Apr YTD low | |
| R1 | 0.6300 | ** | congestion | S4 | 0.5700 | * | late-Mar 2020 (w) low |
Asterisk denotes strength of level
14:45 BST - The test of 0.6200 has given way to a break higher, with prices currently trading around 0.6250. Intraday studies are mixed/positive, suggesting potential for short-term consolidation around here. However, daily readings continue to rise and broader weekly charts are improving, suggesting room for continuation to congestion resistance at 0.6300. Beyond here is stronger resistance at 0.6400/25, but by-then overbought daily stochastics could limit any initial tests in consolidation. Meanwhile, support is at 0.6200. A close beneath here, if seen, would add weight to sentiment and prompt choppy trade above 0.6000.