Chart USD/JPY Update: Leaning lower in JPY-driven trade
Consolidation beneath strong resistance at the 154.40 Fibonacci retracement is giving way to the anticipated minor pullback in JPY-driven trade
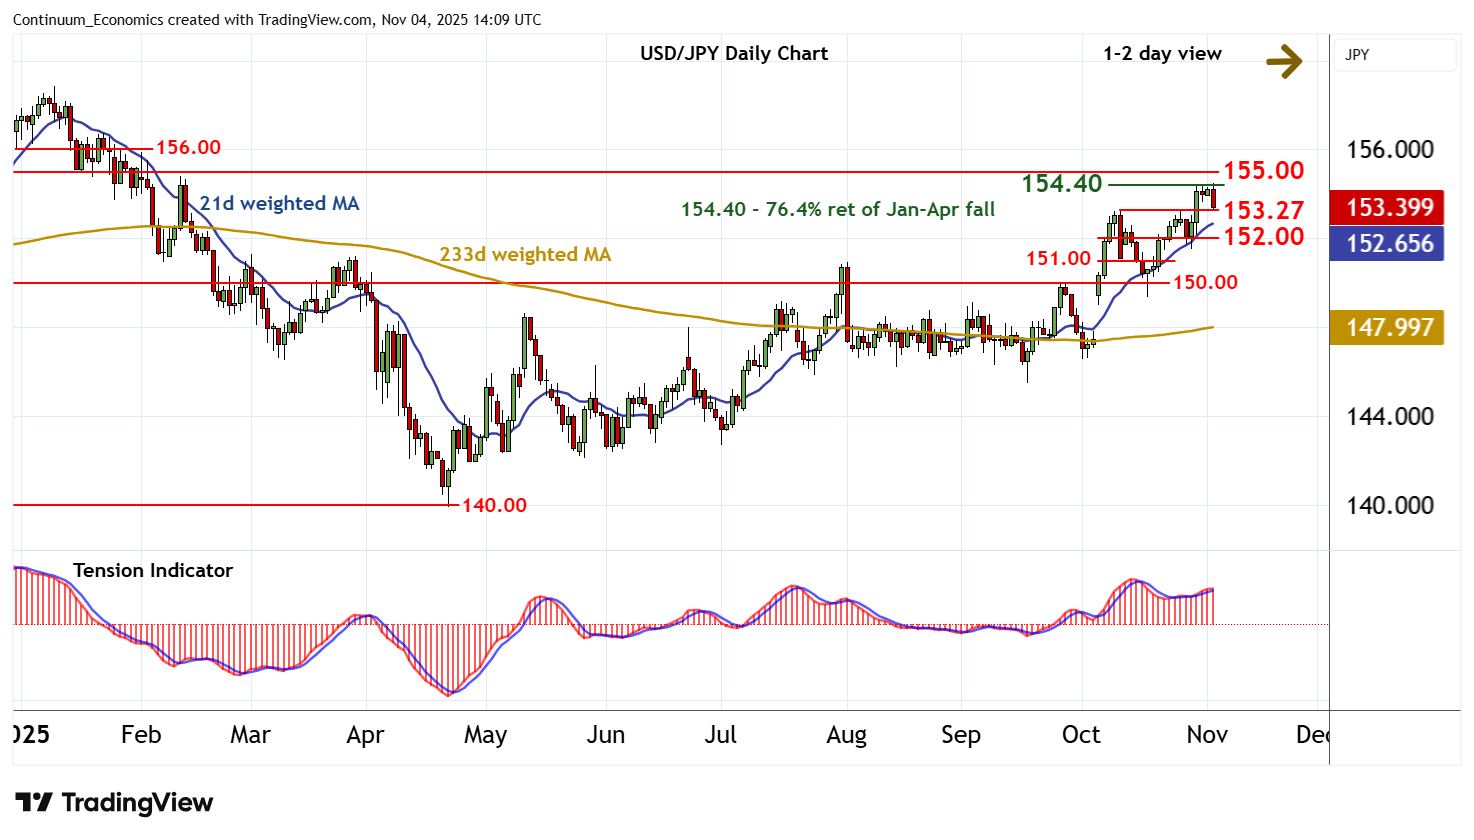
| Levels | Imp | Comment | Levels | Imp | Comment | |||
|---|---|---|---|---|---|---|---|---|
| R4 | 157.00 | * | congestion | S1 | 153.27 | ** | 10 Oct (w) high | |
| R3 | 155.88/00 | * | February high; congestion | S2 | 152.00 | congestion | ||
| R2 | 155.00 | * | congestion | S3 | 151.00 | break level | ||
| R1 | 154.40 | ** | 76.4% ret of Jan-Apr fall | S4 | 150.00 | ** | congestion |
Asterisk denotes strength of level
13:50 GMT - Consolidation beneath strong resistance at the 154.40 Fibonacci retracement is giving way to the anticipated minor pullback in JPY-driven trade, with prices currently consolidating the test of support at the 153.27 weekly high of 10 October. Daily readings are turning down, highlighting room for a test beneath here. But rising weekly charts should limit losses in renewed buying interest above congestion around 152.00. Following corrective trade, fresh gains are looked for. But a close above 154.40 is needed to improve sentiment and extend April gains towards congestion around 155.00. Beyond here is the 155.88 high of February and congestion around 156.00.