Published: 2025-01-13T08:32:00.000Z
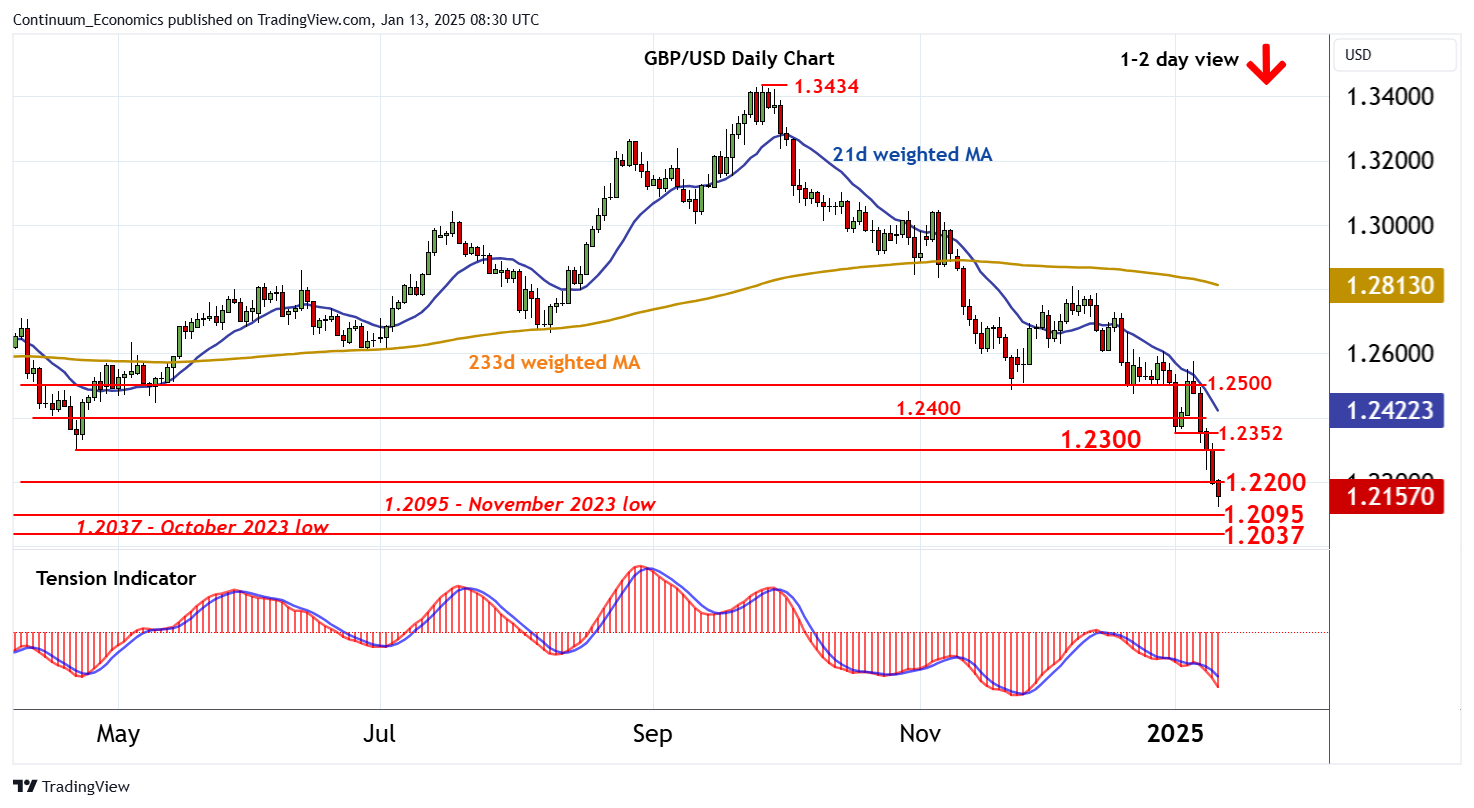
Chart GBP/USD Update: Prices remain under pressure, but studies oversold

Senior Technical Strategist
5

The anticipated minor test above 1.2300 has been pushed back from beneath the 1.2352 weekly low of 2 January

| Level | Comment | Level | Comment | |||||
|---|---|---|---|---|---|---|---|---|
| R4 | 1.2400 | minor congestion | S1 | 1.2125 | intraday low | |||
| R3 | 1.2352 | * | 2 Jan (w) low | S2 | 1.2095 | ** | November 2023 low | |
| R2 | 1.2300 | ** | 22 April 2024 (y) low | S3 | 1.2037 | ** | October 2023 (m) low | |
| R1 | 1.2200 | * | congestion | S4 | 1.2000 | ** | congestion |
Asterisk denotes strength of level
08:10 GMT - The anticipated minor test above 1.2300 has been pushed back from beneath the 1.2352 weekly low of 2 January, with steady losses extending to 1.2025. Flattening oversold intraday studies are prompting consolidation above here. But daily readings continue to track lower and broader weekly charts are also bearish, highlighting room for continuation of September losses towards the 1.2095 low of November 2023. Beneath here are the 1.2037 monthly low of October 2023 and congestion around 1.2000, but already oversold daily and weekly stochastics are expected to limit any initial tests of this broad area in short-covering/consolidation. Meanwhile, resistance is lowered to 1.2200. A close above here would turn sentiment neutral and prompt consolidation beneath 1.2300.