Published: 2025-09-08T11:39:03.000Z
Chart USD/ZAR Update: Daily studies turning down
0
-
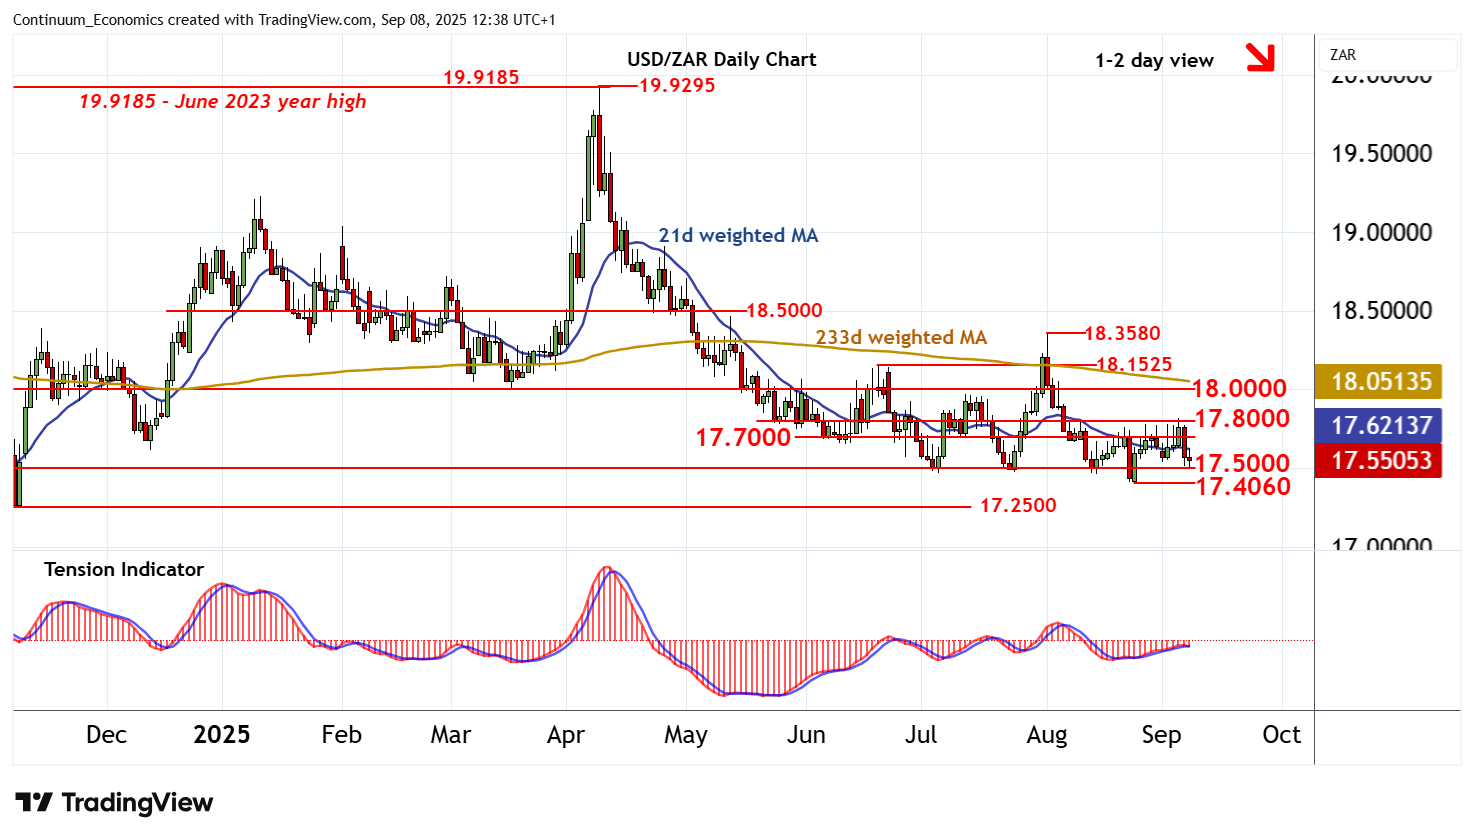
Little change, as prices extend pressure on congestion support at 17.5000
| Level | Comment | Level | Comment | |||||
|---|---|---|---|---|---|---|---|---|
| R4 | 18.1525 | ** | 19 Jun (m) high | S1 | 17.5000 | ** | congestion | |
| R3 | 18.0000 | ** | congestion | S2 | 17.4060 | ** | 25 Aug YTD low | |
| R2 | 17.8000 | * | congestion | S3 | 17.2500 | ** | 7 Nov (m) low | |
| R1 | 17.7000 | * | congestion | S4 | 17.0315 | ** | 30 Sep 2024 (y) low |
Asterisk denotes strength of level
12:05 BST - Little change, as prices extend pressure on congestion support at 17.5000. Intraday studies are under pressure and daily readings are also turning down, unwinding negative divergence, suggesting room for a break beneath here towards critical support at the 17.4060 current year low of 25 August. Rising weekly charts are expected to limit any initial tests in consolidation. But if broken, April losses will then extend towards critical multi-month support at the 17.0315 year low of 30 September 2024. Meanwhile, resistance remains at congestion within 17.7000-17.8000 and should cap any immediate tests higher.