Published: 2025-10-10T11:19:15.000Z
Chart USD/ZAR Update: Choppy above fresh year low
1
The anticipated break down to fresh year lows has bounced smartly from 17.0630
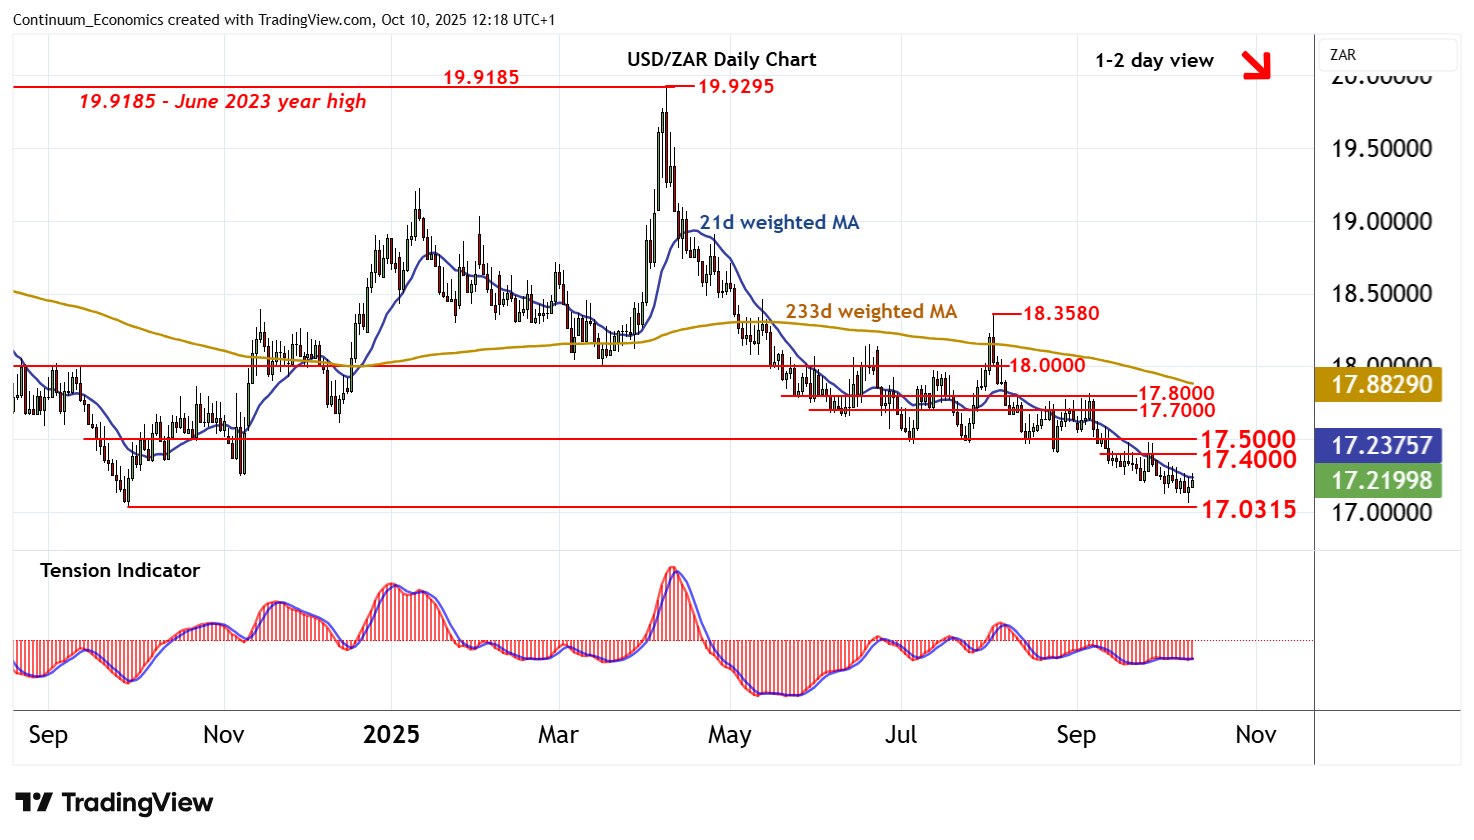
| Level | Comment | Level | Comment | |||||
|---|---|---|---|---|---|---|---|---|
| R4 | 17.8000 | * | congestion | S1 | 17.0630 | * | 9 Oct YTD low | |
| R3 | 17.7000 | * | congestion | S2 | 17.0315 | ** | 30 Sep 2024 (y) low | |
| R2 | 17.5000 | ** | congestion | S3 | 17.0000 | ** | congestion | |
| R1 | 17.4000 | * | break level | S4 | 16.7370 | ** | July 2023 low |
Asterisk denotes strength of level
12:05 BST - The anticipated break down to fresh year lows has bounced smartly from 17.0630, as intraday studies turn higher, with prices currently trading around 17.2200. Daily readings have turned mixed/positive, suggesting room for further strength in the coming sessions. But negative weekly charts are expected to limit scope in renewed selling interest towards resistance at 17.4000. Following cautious trade, fresh losses are looked for. A close below critical support at the 17.0315 year low of 30 September 2024 will turn sentiment outright negative and confirm continuation of May 2023 losses.