Published: 2026-02-23T01:07:55.000Z
Chart USD/JPY Update: Under pressure
1
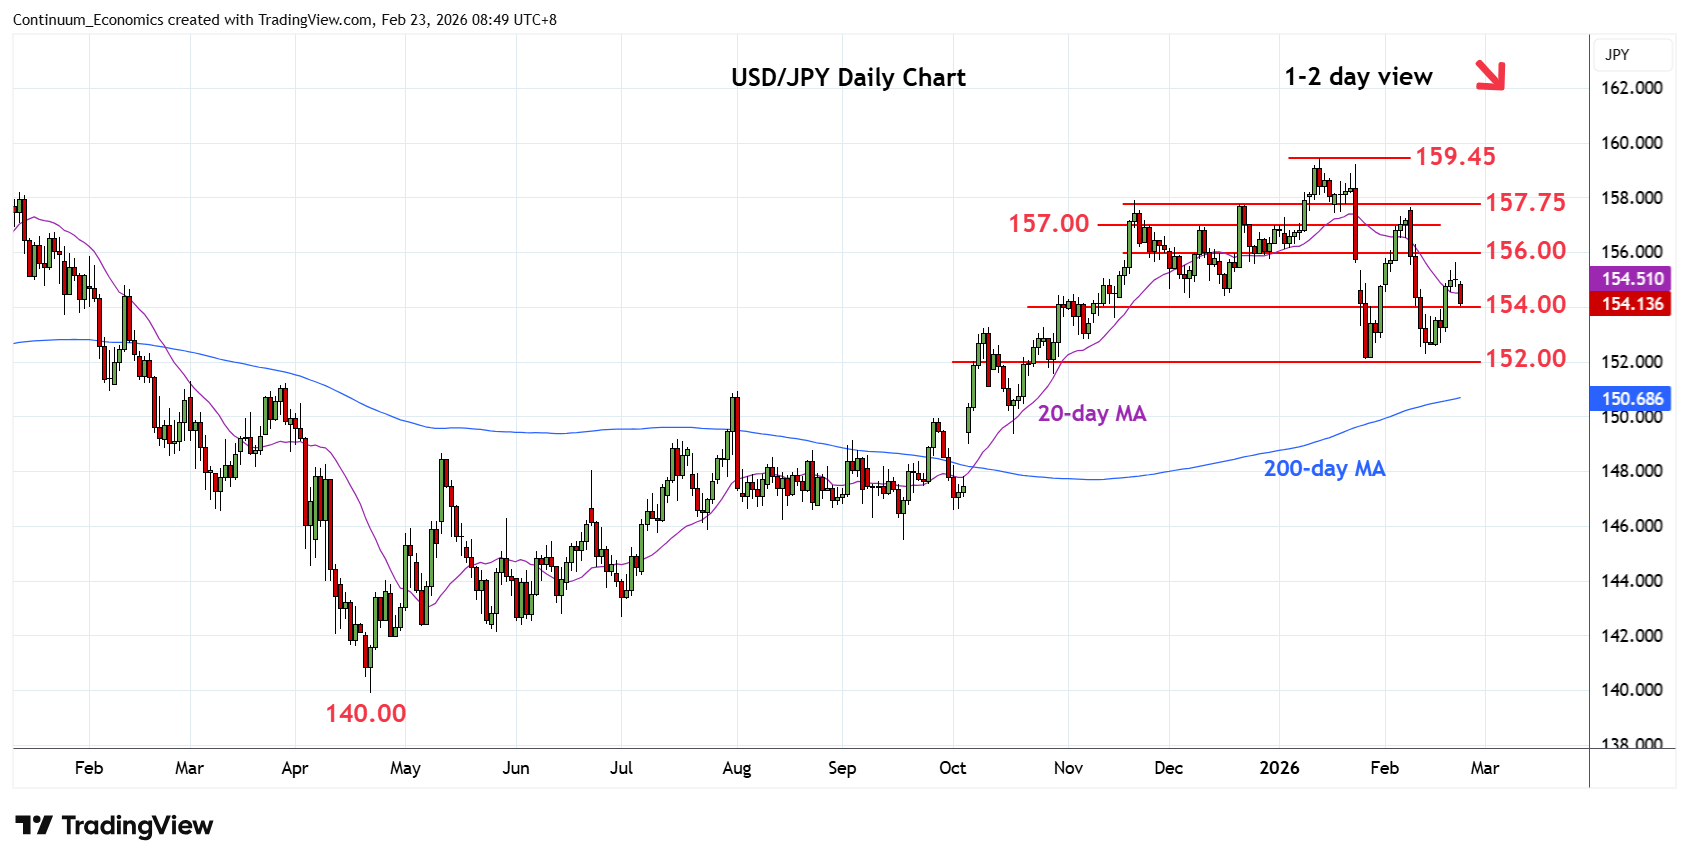
Corrective gains saw resistance at the 155.50/156.00 congestion area capping bounce last week
| Levels | Imp | Comment | Levels | Imp | Comment | |||
|---|---|---|---|---|---|---|---|---|
| R4 | 157.75/90 | ** | Dec, Nov highs | S1 | 154.00 | * | congestion | |
| R3 | 157.00 | * | congestion | S2 | 153.00 | * | 23 Jan low | |
| R2 | 156.00 | * | congestion | S3 | 152.27 | * | 12 Feb low | |
| R1 | 155.50 | * | congestion | S4 | 152.10 | ** | 27 Jan YTD low |
Asterisk denotes strength of level
01:00 GMT - Corrective gains saw resistance at the 155.50/156.00 congestion area capping bounce last week. Rejection from the 155.64 high see prices back to pressure the 154.00 level and where break will open up room for retest of the 153.00 support. Below this will return focus to the February and Janyary lows at 152.27/152.10. Break of these will see room for deeper pullback to retrace gains from the April 2025 year low. Meanwhile, resistance is lowered to 155.00 level which is expected to cap and sustain rejection from the 155.64 high.