Published: 2026-03-20T00:40:08.000Z
Chart NZD/USD Update: Higher in consolidation
-
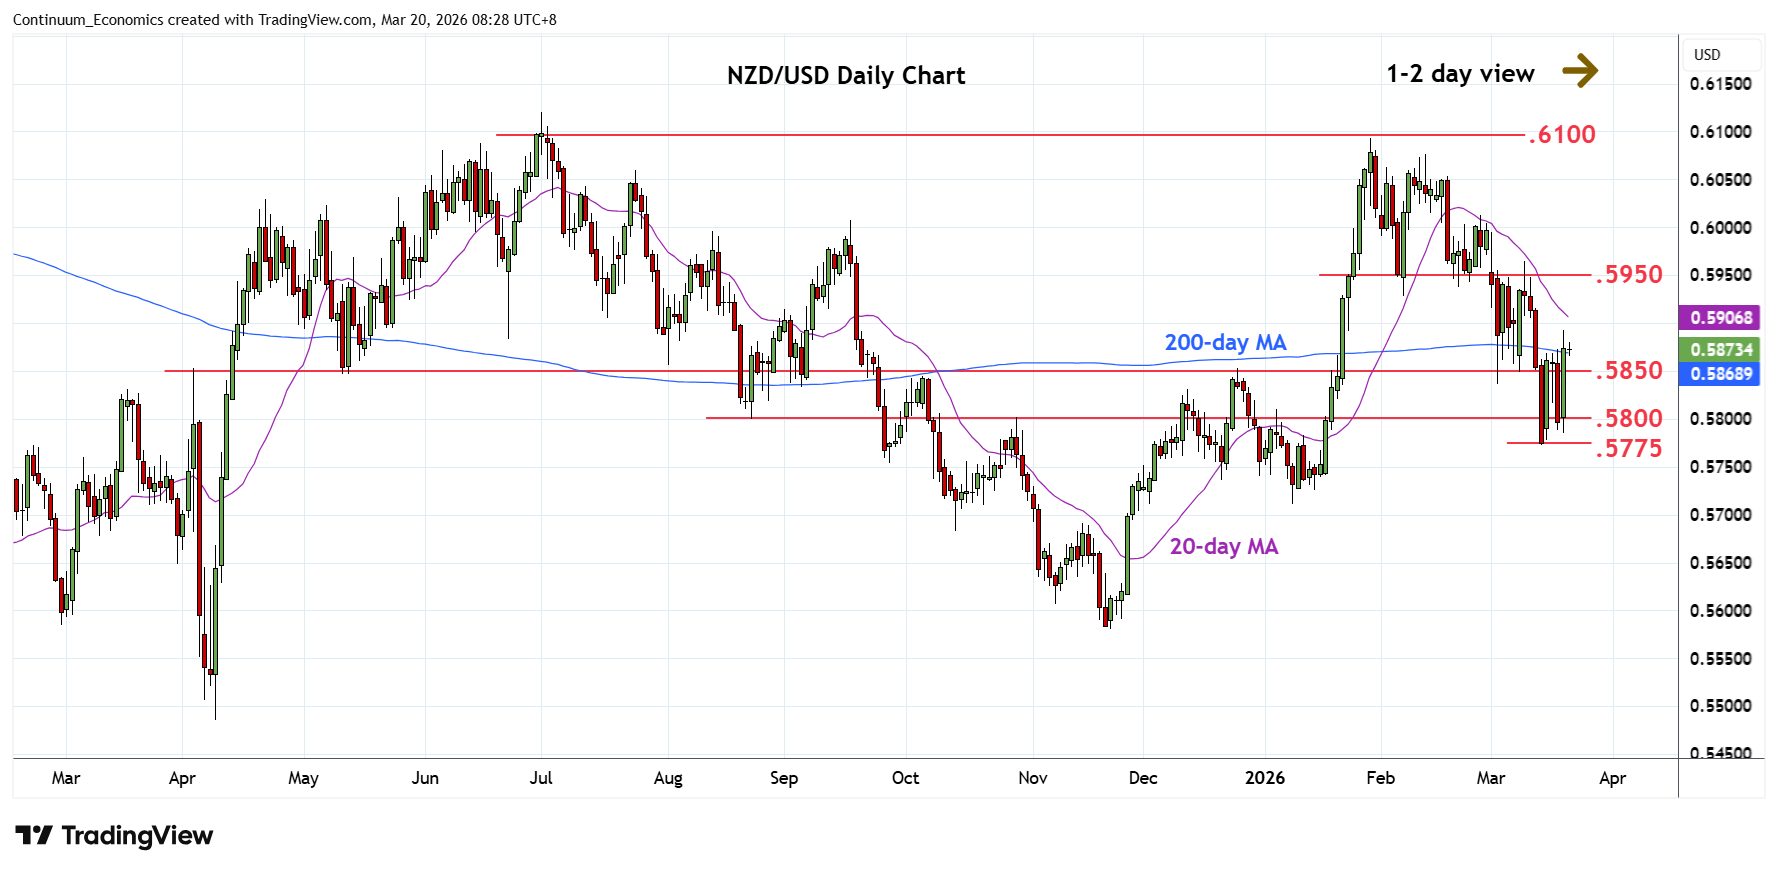
Higher in consolidation from the .5775 Fibonacci level and break above the 200-day MA at .5870 opens up room for stronger gains
| Levels | Imp | Comment | Levels | Imp | Comment | |||
|---|---|---|---|---|---|---|---|---|
| R4 | .6050 | * | congestion | S1 | .5850 | * | congestion | |
| R3 | .6000/13 | * | congestion, 26 Feb high | S2 | .5800 | * | congestion | |
| R2 | .5930/50 | ** | 6 Feb low, congestion | S3 | .5775 | * | 61.8% Nov/Jan rally | |
| R1 | .5900 | * | congestion | S4 | .5710/00 | ** | Jan YTD low, 76.4% |
Asterisk denotes strength of level
00:30 GMT - Higher in consolidation from the .5775 Fibonacci level and break above the 200-day MA at .5870 opens up room for stronger gains towards .5900 level. Higher still, will see room to strong resistance at the .5930/50 area which is expected to cap. Break here, if seen, will fade the downside pressure and see room for extension to retest the .6000 level and higher. Meanwhile, support is raised to .5850/00 congestion area which should now underpin. Failure here will expose the .5775 low to retest and see room to the .5750 congestion and .5710, January current year low