Chart EUR/CAD Update: Under pressure

The pullback from the 1.5960 current year high of 21 April has extended to 1.5665
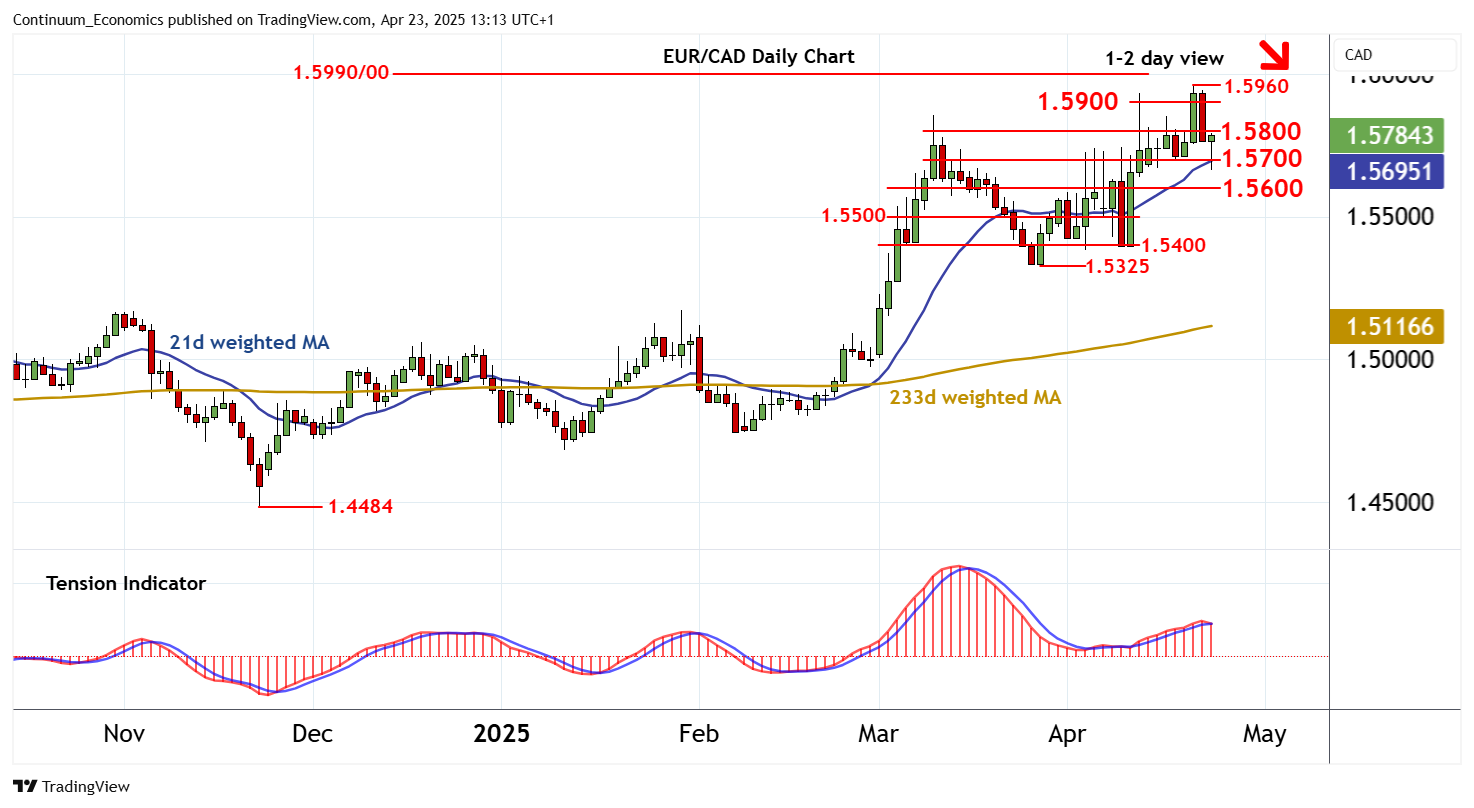
| Level | Comment | Level | Comment | |||||
|---|---|---|---|---|---|---|---|---|
| R4 | 1.5990/00 | ** | Mar 2020 (y) high; cong | S1 | 1.5700 | break level | ||
| R3 | 1.5960 | * | 21 Apr YTD high | S2 | 1.5600 | * | congestion | |
| R2 | 1.5900 | congestion | S3 | 1.5500 | ** | congestion | ||
| R1 | 1.5800 | congestion | S4 | 1.5400 | ** | congestion |
Asterisk denotes strength
12:55 BST - The pullback from the 1.5960 current year high of 21 April has extended to 1.5665, before bouncing sharply into consolidation beneath congestion resistance at 1.5800. Daily stochastics are tracking lower, away from overbought areas and unwinding negative divergence, and the daily Tension Indicator is also turning down, highlighting a deterioration in sentiment and difficulty sustaining any immediate break above here. In the coming sessions, cautious trade is expected to give way to fresh losses. A break below support at 1.5700 will add weight to sentiment and open up congestion around 1.5600. However, rising weekly charts could prompt fresh consolidation above here. Meanwhile, congestion around 1.5900 should cap any immediate tests above 1.5800.