Published: 2026-04-14T15:56:39.000Z
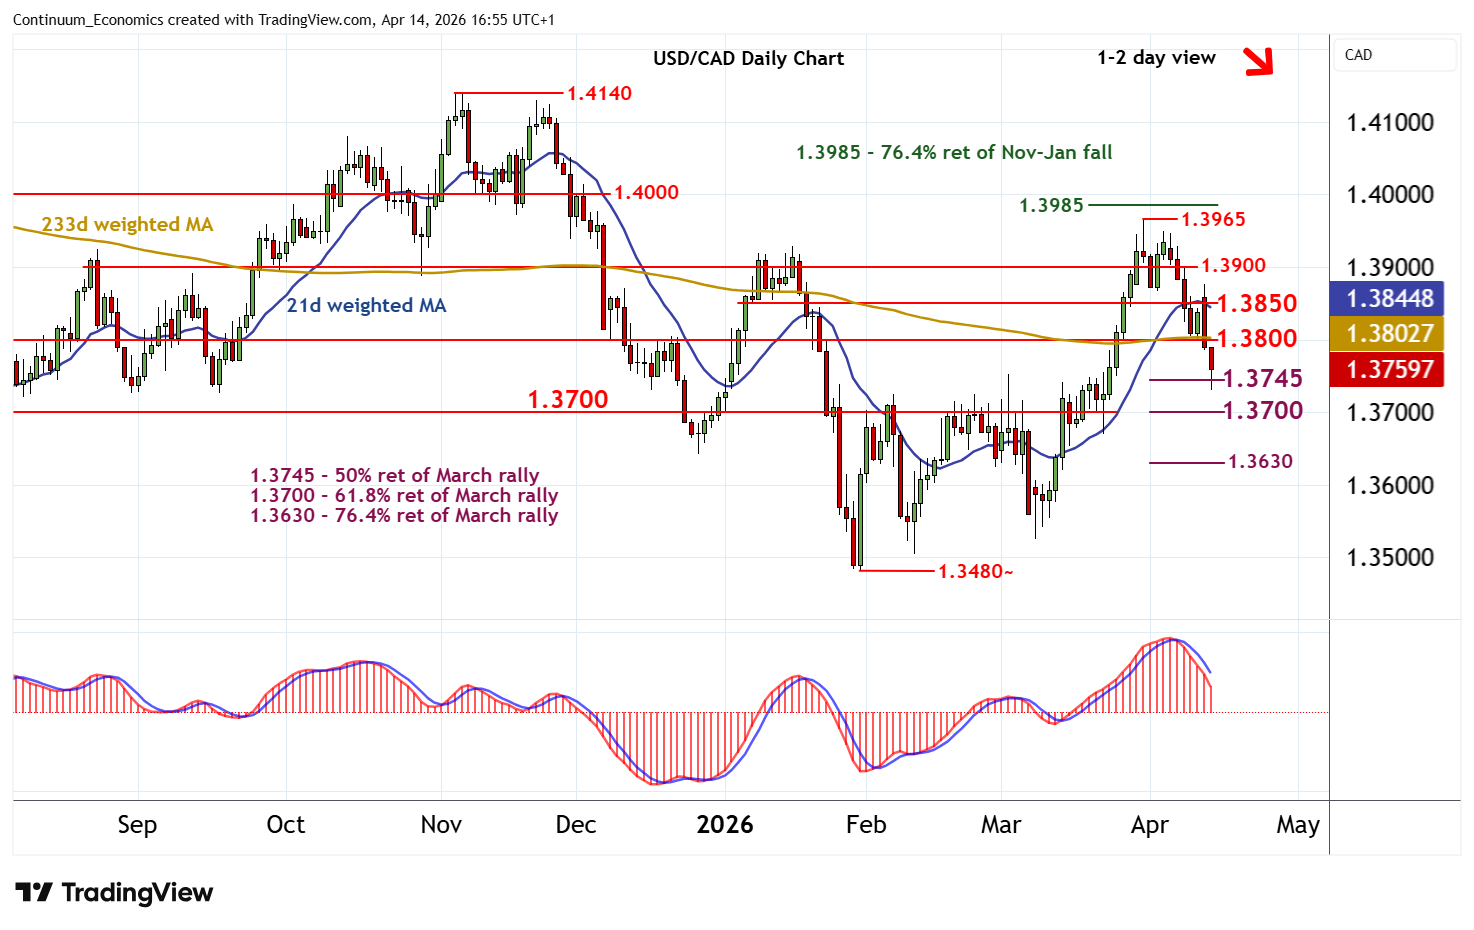
Chart USD/CAD Update: Reached the 1.3745 Fibonacci retracement - studies under pressure
2
Anticipated losses have tested below the 1.3745 Fibonacci retracement to reach 1.3730
| Levels | Imp | Comment | Levels | Imp | Comment | |||
|---|---|---|---|---|---|---|---|---|
| R4 | 1.3965 | * | 31 Mar YTD high | S1 | 1.3745 | ** | 50% ret of March rally | |
| R3 | 1.3900 | * | congestion | S2 | 1.3700 | ** | cong, 61.8% ret | |
| R2 | 1.3850 | * | congestion | S3 | 1.3650 | * | congestion | |
| R1 | 1.3800 | * | congestion | S4 | 1.3630 | ** | 76.4% ret of March rally |
Asterisk denotes strength of level
16:35 BST - Anticipated losses have tested below the 1.3745 Fibonacci retracement to reach 1.3730, before bouncing back above here as oversold intraday studies unwind. Daily readings continue to track lower and overbought weekly stochastics are unwinding, highlighting room for further losses in the coming sessions. A close below 1.3730 will add weight to sentiment and extend late-March losses towards strong support at 1.3700. Flat oversold daily stochastics could limit any initial tests of here in consolidation. Meanwhile, resistance is lowered to congestion around 1.3800 and should cap any immediate tests higher.