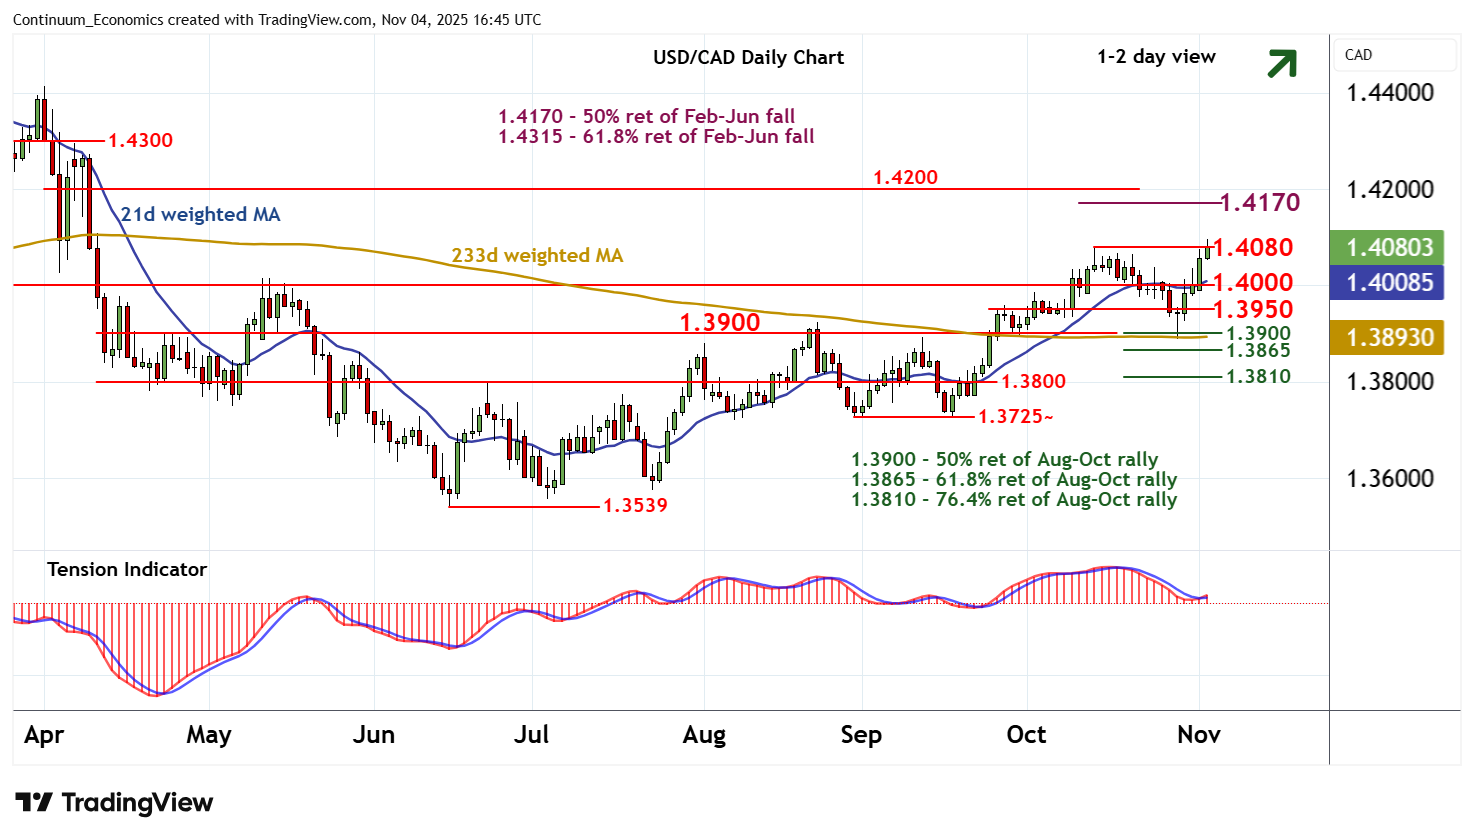
Chart USD/CAD Update: Pressuring strong resistance at 1.4080
The retest of strong resistance at the 1.4080 weekly high of 14 October has reached 1.4195~
| Levels | Imp | Comment | Levels | Imp | Comment | |||
|---|---|---|---|---|---|---|---|---|
| R4 | 1.4300 | * | break level | S1 | 1.4000 | * | break level | |
| R3 | 1.4200 | * | congestion | S2 | 1.3950 | * | pivot | |
| R2 | 1.4170 | ** | 50% ret of Feb-Jun fall | S3 | 1.3900 | ** | break level, 50% ret | |
| R1 | 1.4080 | ** | 14 Oct (w) high | S4 | 1.3865 | ** | 61.8% ret of Aug-Oct rally |
Asterisk denotes strength of level
16:35 GMT - The retest of strong resistance at the 1.4080 weekly high of 14 October has reached 1.4195~, where flat overbought intraday studies are prompting a pullback into renewed consolidation around 1.4080. Daily readings continue to rise and broader weekly charts are mixed/positive, highlighting room for further strength in the coming sessions. A close above 1.4080 will improve price action and extend mid-June gains towards strong resistance at the 1.4170 Fibonacci retracement and congestion around 1.4200. However, already overbought weekly stochastics are expected to limit any initial tests in consolidation. Meanwhile, support remains at the 1.4000 break level, and should underpin any immediate setbacks.