Published: 2026-03-24T01:02:57.000Z
Chart USD/JPY Update: Choppy below 159.75/90 highs
4
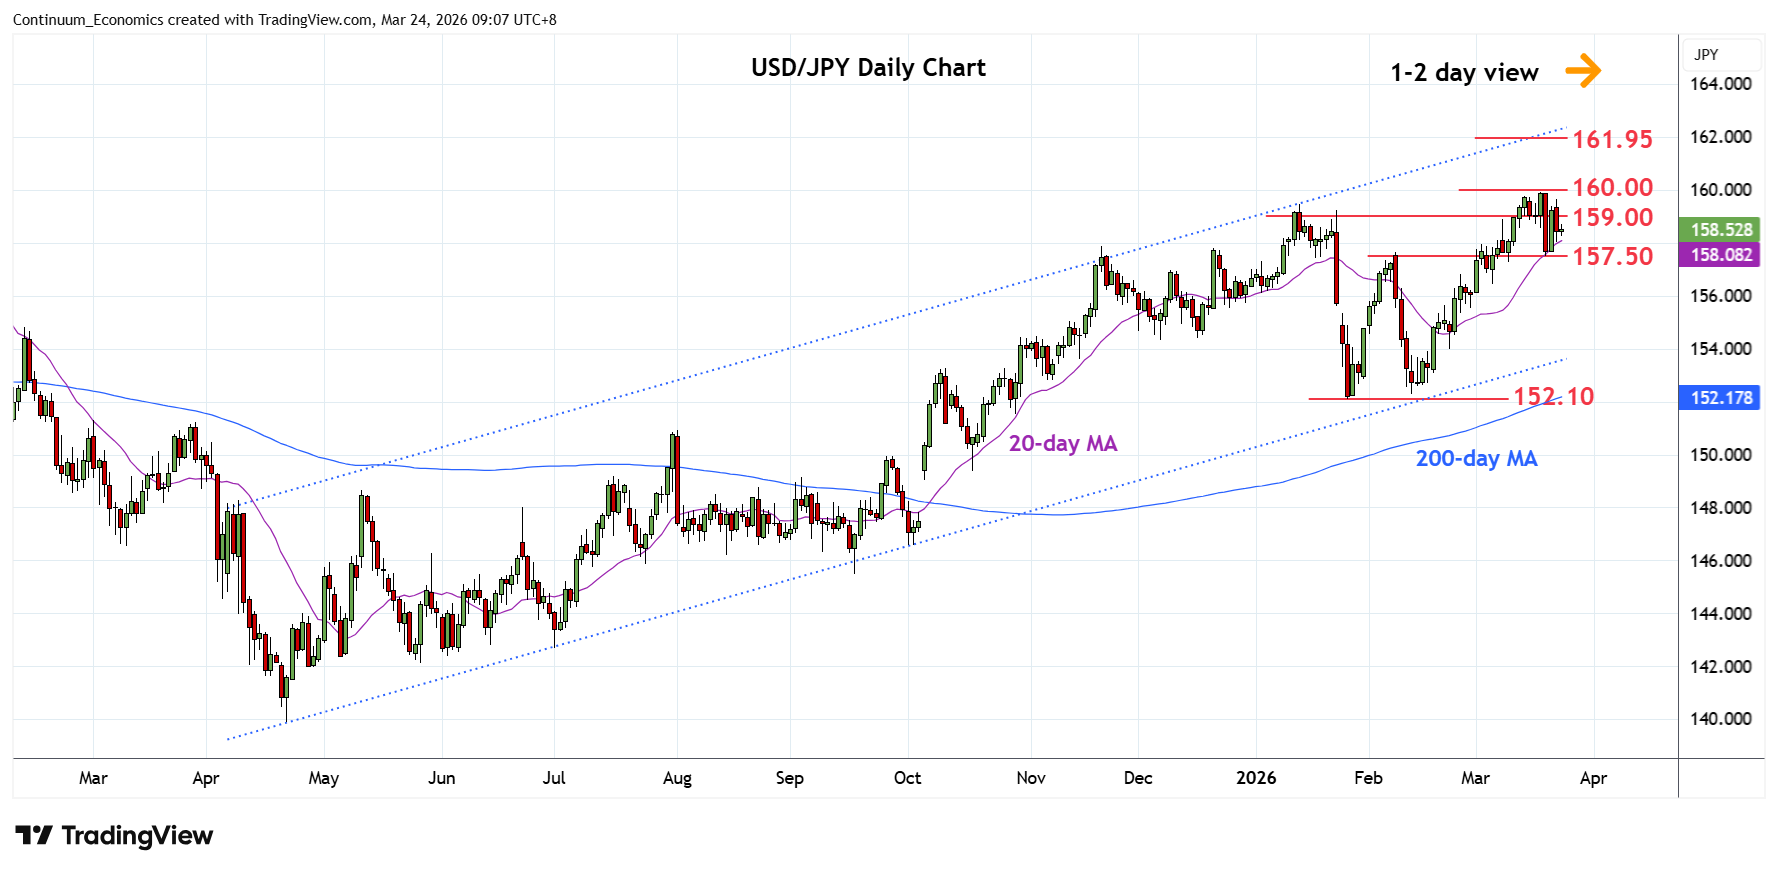
Bounce from the 157.50 low of last week has seen gains giving way to selling pressure beneath the 159.75/90 highs
| Levels | Imp | Comment | Levels | Imp | Comment | |||
|---|---|---|---|---|---|---|---|---|
| R4 | 161.00 | * | congestion | S1 | 158.00 | * | congestion | |
| R3 | 160.00 | * | congestion | S2 | 157.50 | ** | 19 Mar low | |
| R2 | 159.90 | ** | 18 Mar YTD high | S3 | 157.00 | * | congestion | |
| R1 | 159.75 | * | 13 Mar high | S4 | 156.45 | * | 5 Mar low |
Asterisk denotes strength of level
01:00 GMT - Bounce from the 157.50 low of last week has seen gains giving way to selling pressure beneath the 159.75/90 highs. Daily studies are mixed and suggest this area expected to cap. Clearance here, if seen, will see room for extension to the 161.00 level then the 161.95, July 2024 multi-year high. Meanwhile, support is raised to the 158.00 level and extending to 157.50 low. Would take break here to open up room for deeper pullback to retrace strong gains from the 152.27, February low. Lower will see room to support at 157.00 congestion then the 156.45/00 area.