Published: 2025-09-11T15:37:42.000Z
Chart USD/CAD Update: Lower in range
0
-
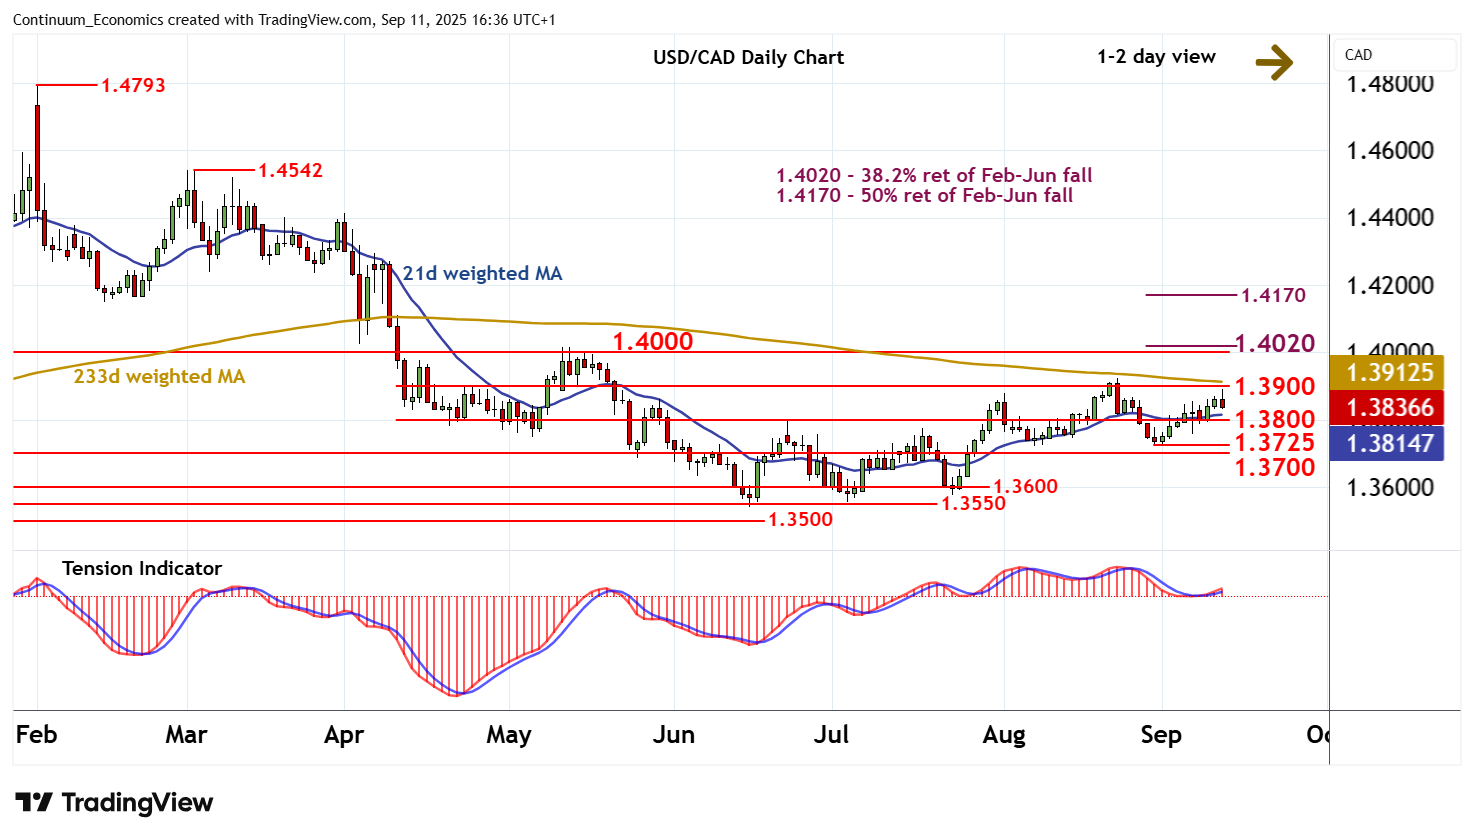
Anticipated gains have met selling interest just shy of resistance at 1.3900

| Levels | Imp | Comment | Levels | Imp | Comment | |||
|---|---|---|---|---|---|---|---|---|
| R4 | 1.4200 | ** | congestion | S1 | 1.3800 | * | congestion | |
| R3 | 1.4170 | ** | 50% ret of Feb-Jun fall | S2 | 1.3725 | * | 29 Aug (w) low | |
| R2 | 1.4000/20 | ** | break level; 38.2% ret | S3 | 1.3700 | ** | congestion | |
| R1 | 1.3900 | ** | break level | S4 | 1.3600 | ** | congestion |
Asterisk denotes strength of level
16:20 BST - Anticipated gains have met selling interest just shy of resistance at 1.3900, as intraday studies turn down, with focus on congestion support at 1.3800. However, daily readings continue to rise and broader weekly charts are mixed, suggesting any initial tests could give way to renewed consolidation. A break, if seen, will open up strong support at the 1.3725 weekly low of 29 August, where fresh buying interest is expected to appear. Meanwhile, a close above 1.3900, if seen, will turn sentiment positive and extend June gains towards strong resistance at 1.4000 and the 1.4020 Fibonacci retracement.