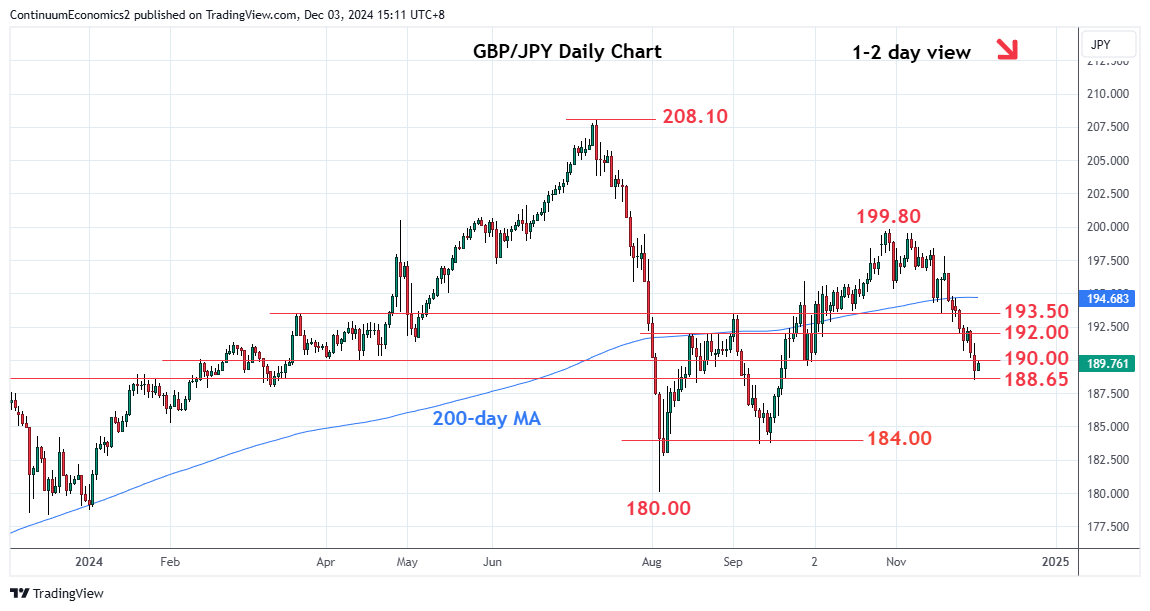
Break of the 190.00 level and 50% Fibonacci retracement has seen extension to reach support at the 188.65, 2023 year high

| Levels | Imp | Comment | Levels | Imp | Comment | |||
|---|---|---|---|---|---|---|---|---|
| R4 | 195.35 | ** | 31 Oct low | S1 | 188.65 | * | Nov 2023 year high | |
| R3 | 193.50 | * | Mar high, congestion | S2 | 187.55 | * | 61.8% Aug/Oct rally | |
| R2 | 192.00 | * | congestion | S3 | 186.00 | * | congestion | |
| R1 | 190.68 | * | 27 Nov low | S4 | 184.00 | * | congestion |
Asterisk denotes strength of level
07:15 GMT - Break of the 190.00 level and 50% Fibonacci retracement has seen extension to reach support at the 188.65, 2023 year high. Pause here see prices unwinding the oversold intraday studies but the negative daily and weekly studies suggest room for break here later. Lower will open up further extension to support at the 61.8% Fibonacci retracement at 187.55 then the 186.00 congestion. Meanwhile, resistance is lowered to 190.68 and this extend to the 192.00 congestion area which is expected to cap. Only above here will see room for stronger bounce to the 193.50/194.00 resistance.