Published: 2025-04-02T12:49:00.000Z
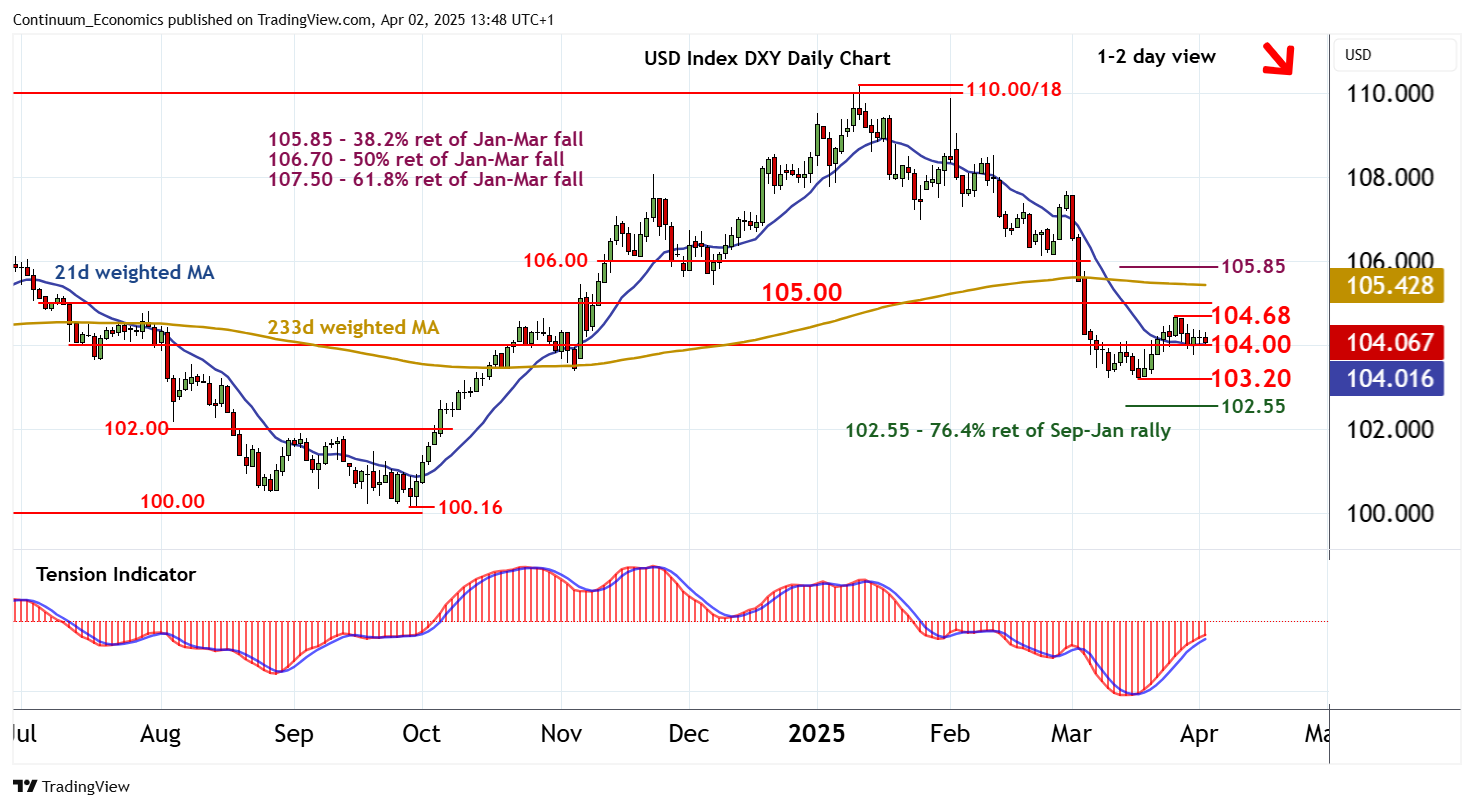
Chart USD Index DXY Update: Consolidating - studies leaning lower

Senior Technical Strategist
2

Little change, as prices extend consolidation above congestion support at 104.00

| Levels | Imp | Comment | Levels | Imp | Comment | |||
|---|---|---|---|---|---|---|---|---|
| R4 | 106.00 | ** | break level | S1 | 104.00 | * | congestion | |
| R3 | 105.85 | ** | 38.2% ret of Jan-Mar fall | S2 | 103.20 | ** | 18 Mar YTD low | |
| R2 | 105.00 | break level | S3 | 103.00 | * | congestion | ||
| R1 | 104.68 | * | 26 Mar (w) high | S4 | 102.55 | ** | 76.4% ret of Sep-Jan rally |
Asterisk denotes strength of level
13:40 BST - Little change, as prices extend consolidation above congestion support at 104.00. Intraday studies are turning down and daily readings are mixed/negative, highlighting room for fresh losses in the coming sessions. A break beneath here will add weight to sentiment and open up critical support at the 103.20 current year low of 18 March. However, mixed weekly charts are expected to limit any initial tests in fresh consolidation, before bearish longer-term charts prompt a break and extend January losses. Meanwhile, resistance remains at the 104.68 weekly high of 26 March and should cap any immediate tests higher.