Published: 2025-02-19T13:54:34.000Z
Chart USD Index DXY Update: Potential for a minor test higher

Senior Technical Strategist
-
Cautious trade has given way to a test above resistance at 107.00
| Levels | Imp | Comment | Levels | Imp | Comment | |||
|---|---|---|---|---|---|---|---|---|
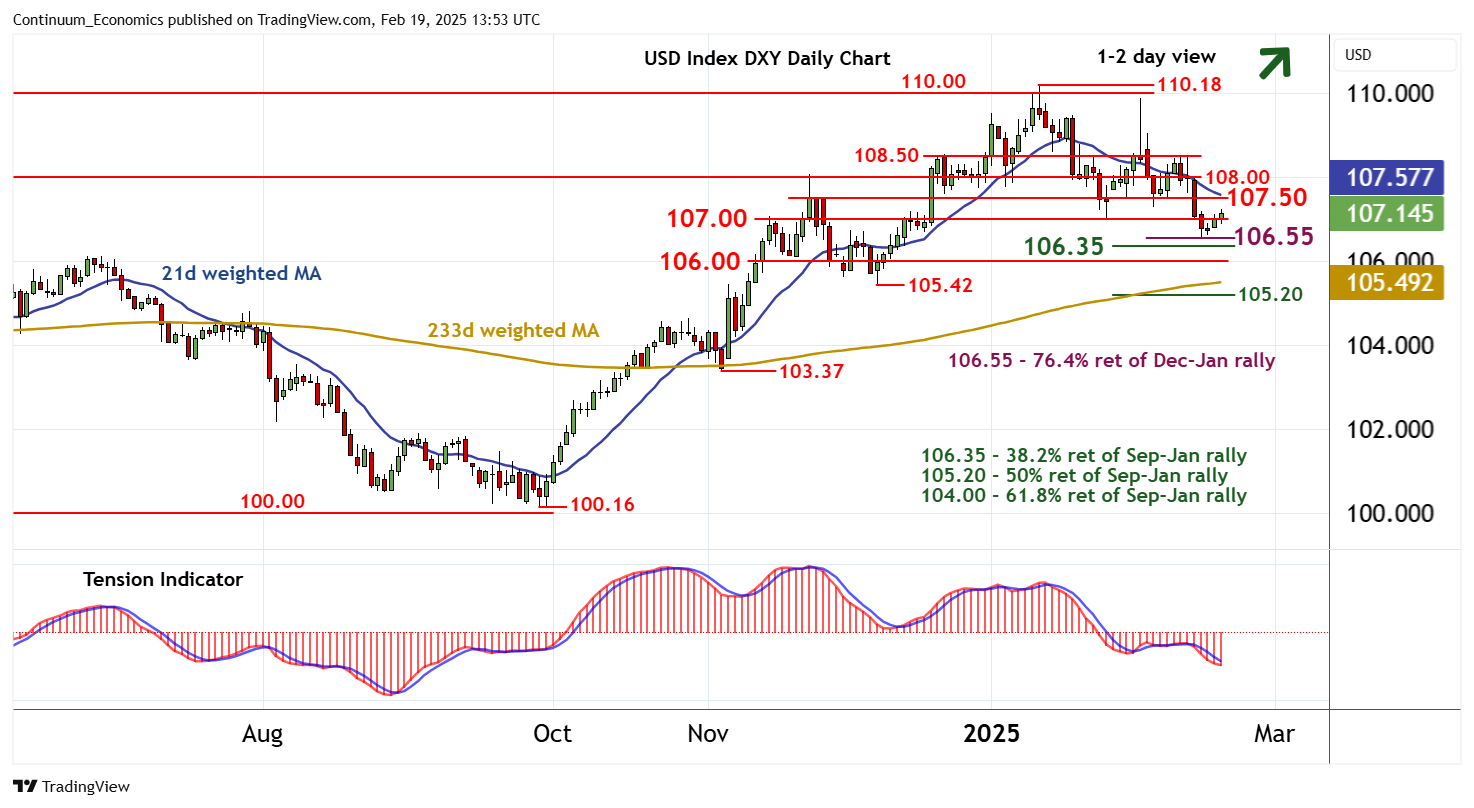
| R4 | 108.50 | minor break level | S1 | 106.55 | ** | 76.4% ret of Dec-Jan rally | ||
| R3 | 108.00 | break level | S2 | 106.35 | ** | 38.2% ret of Sep-Jan rally | ||
| R2 | 107.50 | * | congestion | S3 | 106.00 | ** | congestion | |
| R1 | 107.00 | ** | break level | S4 | 105.42 | ** | 6 Dec (m) low |
Asterisk denotes strength of level
13:55 GMT - Cautious trade has given way to a test above resistance at 107.00, with prices currently trading around 107.10. Oversold daily stochastics are ticking higher, suggesting room for further strength in the coming sessions. But the negative daily Tension Indicator and bearish weekly charts are expected to limit scope in renewed selling interest beneath congestion around 107.50. Following corrective/cautious trade, fresh losses are looked for. A later break below support at the 106.55 Fibonacci retracement will extend January losses towards the 106.35 Fibonacci retracement, ahead of congestion around 106.00.