Published: 2025-02-07T00:34:11.000Z
Chart USD/JPY Update: Extending losses

Technical Analyst
2
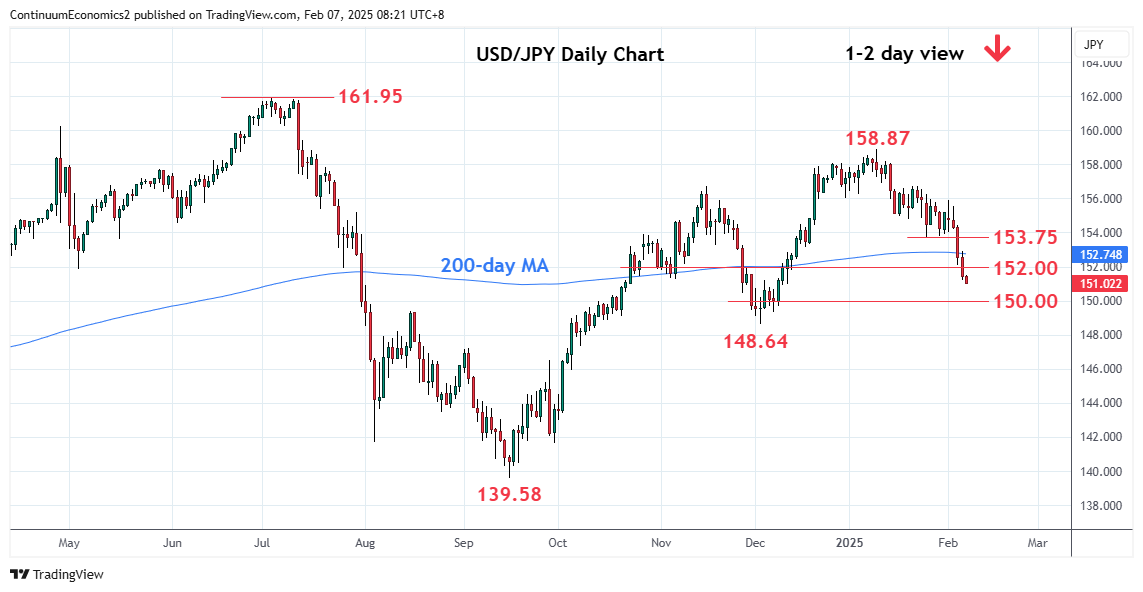
Sharply lower to extend the mid-week break of the 154.00/153.75 support through the 152.00 support
| Levels | Imp | Comment | Levels | Imp | Comment | |||
|---|---|---|---|---|---|---|---|---|
| R4 | 155.00 | * | congestion | S1 | 151.00 | * | 11 Dec low | |
| R3 | 153.75/00 | ** | Jan low, congestion | S2 | 150.00 | * | figure, congestion | |
| R2 | 152.90 | * | 6 Feb high | S3 | 149.25 | * | 50% Sep/Jan rally | |
| R1 | 152.00 | * | congestion | S4 | 148.64 | ** | Dec low |
Asterisk denotes strength of level
00:30 GMT - Sharply lower to extend the mid-week break of the 154.00/153.75 support through the 152.00 support. Break of the 151.00 level will open up room to the 150.50 congestion then the 150.00 figure where reaction can be expected as the intraday and daily studies extend into oversold areas. However, bearish momentum highlights risk for break to open up room to the 149.25, 50% Fibonacci level, then the 148.64 low of December. Meanwhile, resistance is lowered to the 152.00 level which should now cap corrective bounce.