Published: 2025-08-04T07:30:19.000Z
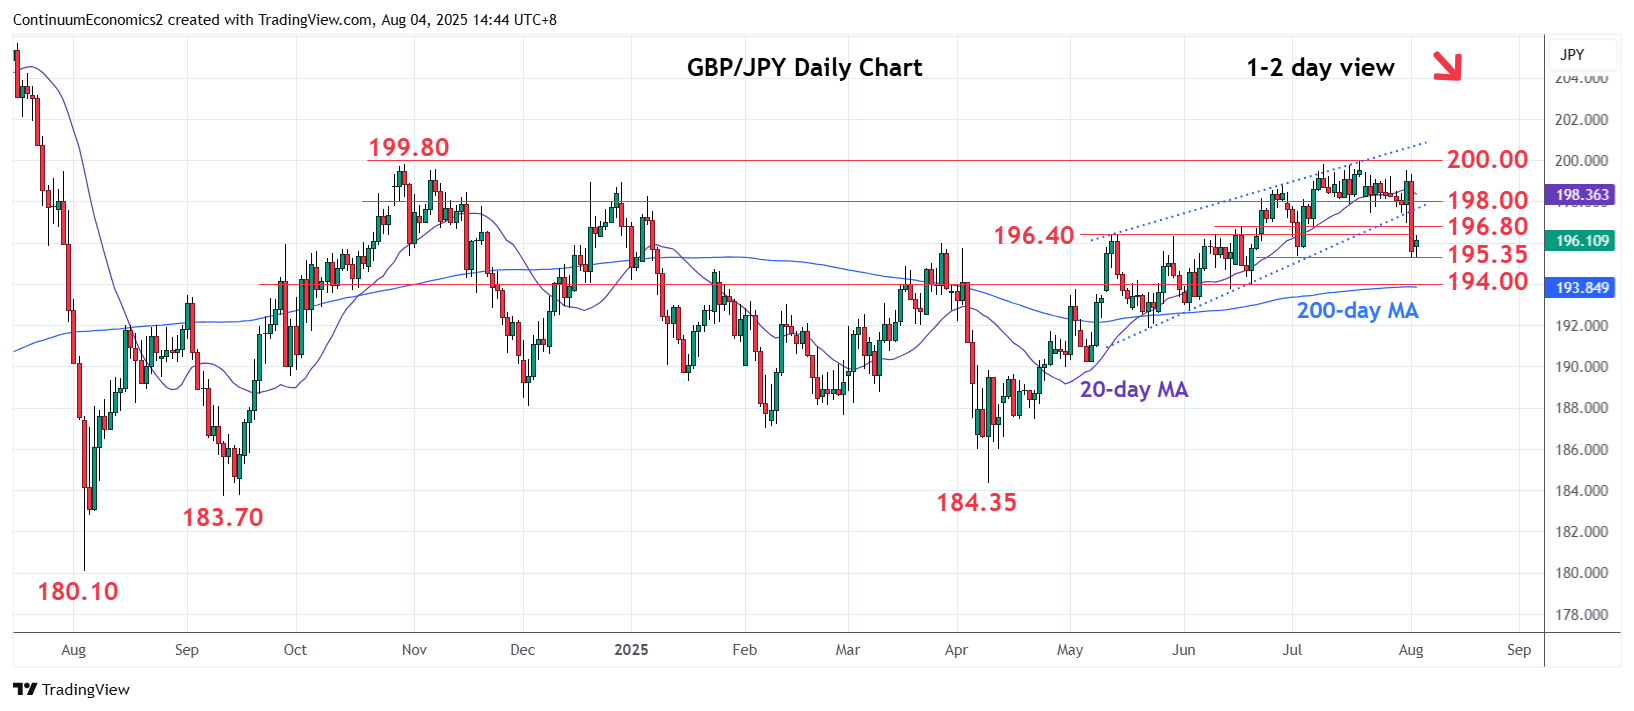
Chart GBP/JPY Update: Consolidating sharp losses to 195.35 support

Technical Analyst
4
Break of the 198.00 level and 197.40 support saw sharp losses to reach 195.35 support on Friday
| Levels | Imp | Comment | Levels | Imp | Comment | |||
|---|---|---|---|---|---|---|---|---|
| R4 | 199.50 | ** | 31 Jul high | S1 | 195.35 | * | 2 Jul low | |
| R3 | 198.00 | * | congestion | S2 | 194.00 | * | congestion, 38.2% | |
| R2 | 197.40 | * | 22 Jul low | S3 | 192.70 | * | Jun low | |
| R1 | 196.40/80 | * | May, 17 Jun highs | S4 | 192.15/00 | * | 50% Apr/Jul rally, congestion |
Asterisk denotes strength of level
07:20 GMT - Break of the 198.00 level and 197.40 support saw sharp losses to reach 195.35 support on Friday. Consolidation here see prices unwinding the oversold intraday studies but negative daily and weekly chart suggest this giving way to fresh selling pressure later. Lower will see room for deeper pullback to retrace the April/July rally and see extension to the 194.00 congestion and 38.2% Fibonacci level. Meanwhile, resistance is lowered to the 196.40/196.80 area which is expected to cap.