Published: 2025-11-05T13:17:37.000Z
Chart USD/ZAR Update: Lower from strong resistance - background studies rising
1
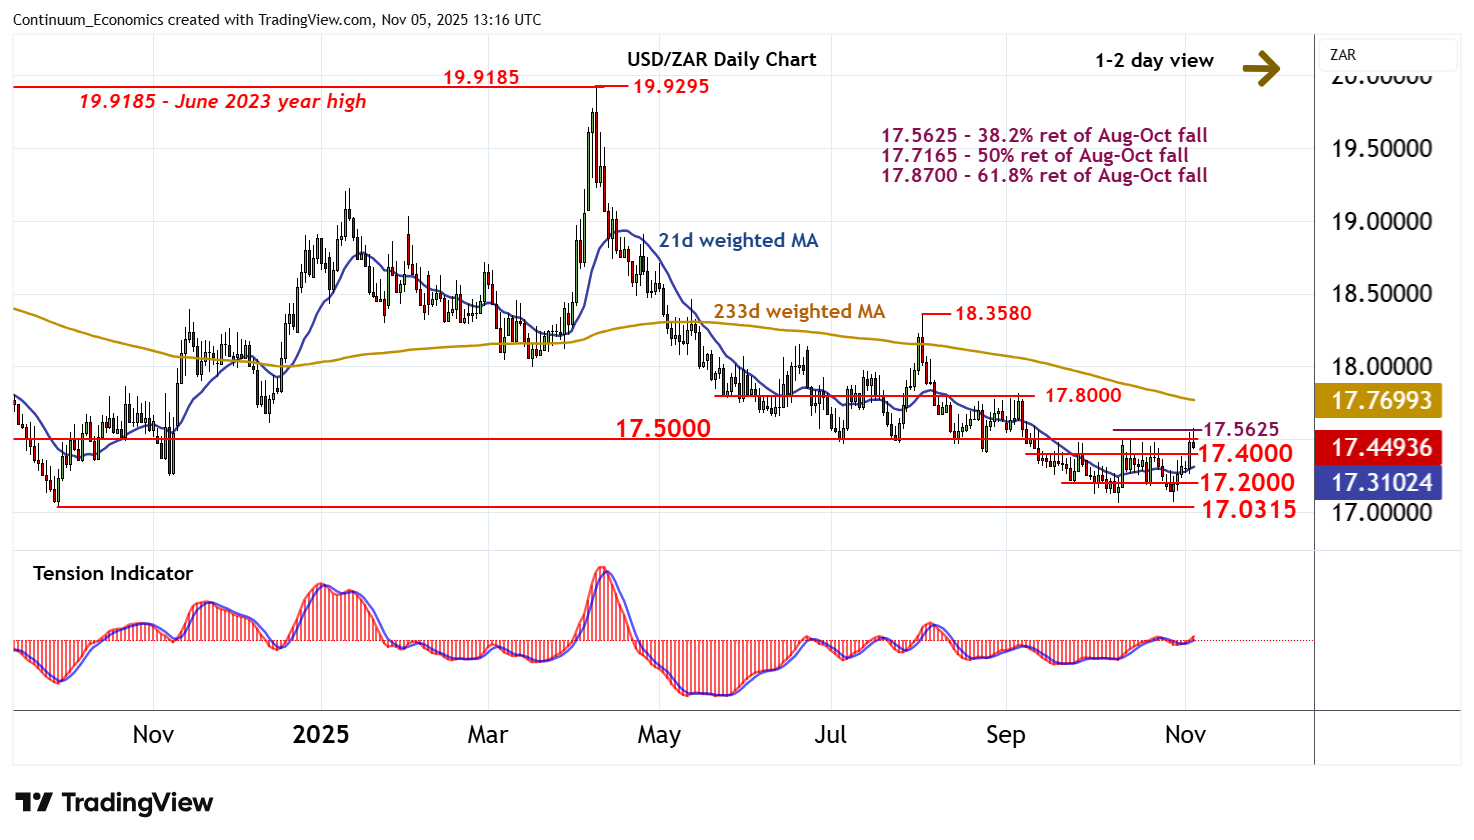
The anticipated break above congestion resistance at 17.5000 has been pushed back from the 17.5625 Fibonacci retracement
| Level | Comment | Level | Comment | |||||
|---|---|---|---|---|---|---|---|---|
| R4 | 18.0000 | ** | break level | S1 | 17.4000 | * | congestion | |
| R3 | 17.8000 | break level | S2 | 17.2000 | * | congestion | ||
| R2 | 17.5625 | ** | 38.2% ret of Aug-Oct fall | S3 | 17.0630 | * | 9 Oct YTD low | |
| R1 | 17.5000 | ** | congestion | S4 | 17.0315 | ** | 30 Sep 2024 (y) low |
Asterisk denotes strength of level
12:30 GMT - The anticipated break above congestion resistance at 17.5000 has been pushed back from the 17.5625 Fibonacci retracement, as overbought daily stochastics flatten, with focus turning to congestion support at 17.4000. A break beneath here cannot be ruled out. But the rising daily Tension Indicator and positive weekly charts should limit scope in renewed buying interest/consolidation above further congestion around 17.2000. Following cautious trade, fresh gains are looked for. But a close above 17.5625 is needed to turn sentiment positive and extend October gains towards 17.8000.