Published: 2025-12-09T07:58:12.000Z
Chart AUD/NZD Update: Consolidating test of 1.1500 resistance
-
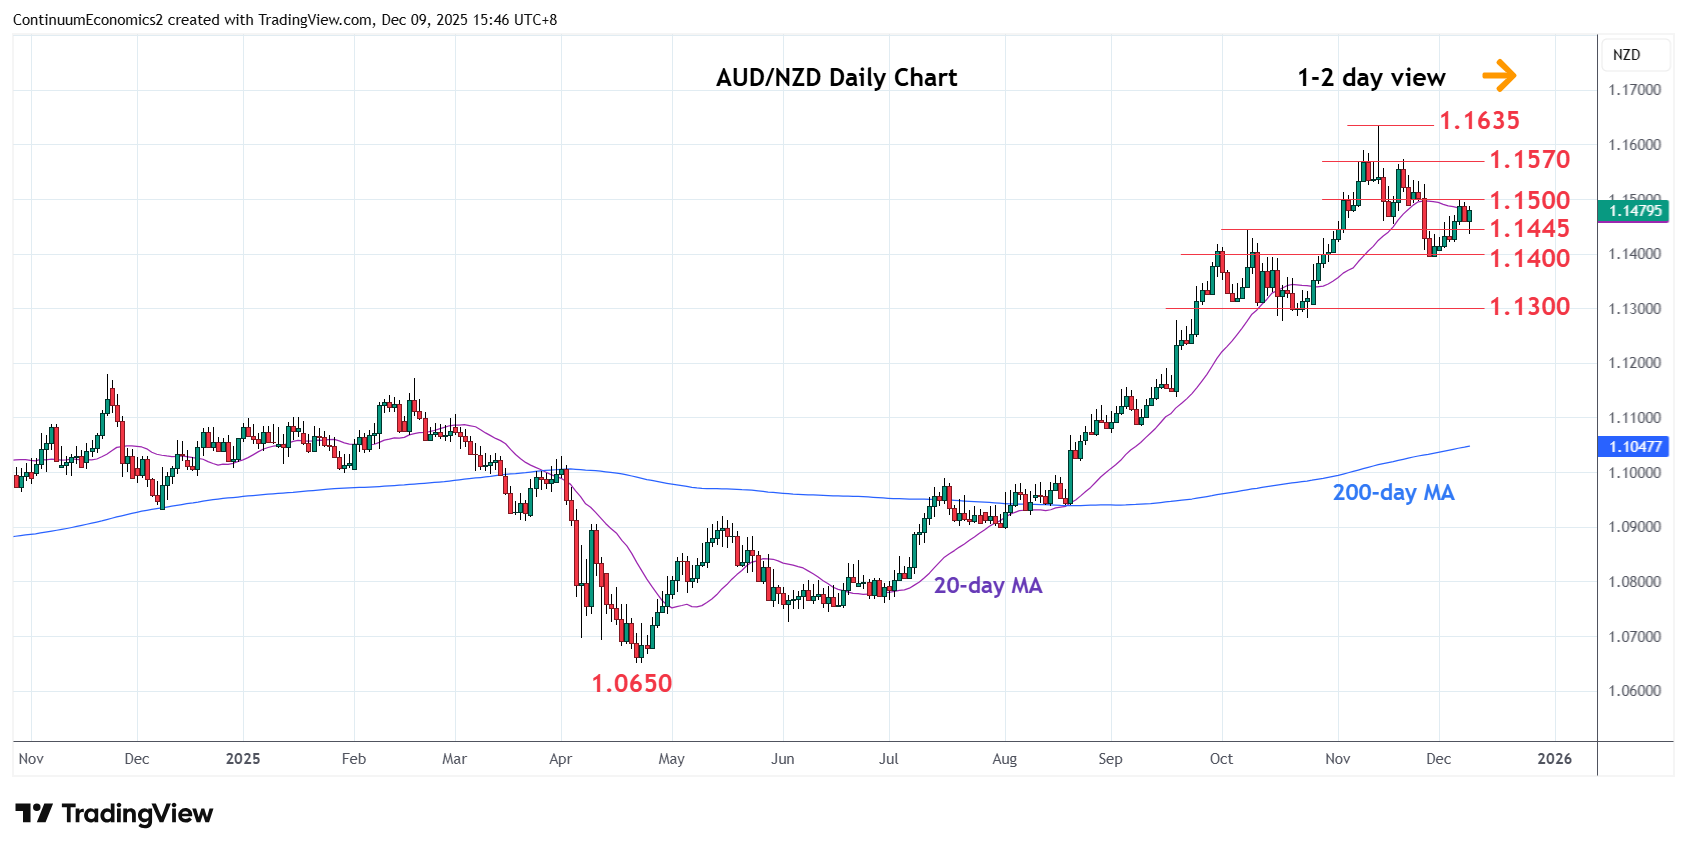
Lower in consolidation from test of resistance at the 1.1500 level as prices unwind overbought intraday studies
| Level | Comment | Level | Comment | |||||
|---|---|---|---|---|---|---|---|---|
| R4 | 1.1660 | * | Sep 2013 high | S1 | 1.1400 | * | congestion | |
| R3 | 1.1600/35 | ** | congestion, 13 Nov YTD high | S2 | 1.1350 | * | congestion | |
| R2 | 1.1570 | * | 20 Nov high | S3 | 1.1300 | * | congestion | |
| R1 | 1.1500 | * | congestion | S4 | 1.1260 | * | 38.2% Apr/Nov rally |
Asterisk denotes strength of level
07:50 GMT - Lower in consolidation from test of resistance at the 1.1500 level as prices unwind overbought intraday studies. Consolidation is expected to give way to selling pressure later to extend losses from the 1.1635 high. Below the 1.1400 level will open up room for deeper pullback to retrace the April/November rally and see room to 1.1350/00 congestion then 1.1260, 38.2% Fibonacci level. Break above the 1.1500 resistance needed to clear the way for stronger gains to the retest of 1.1570 congestion and 1.1635, November YTD high.