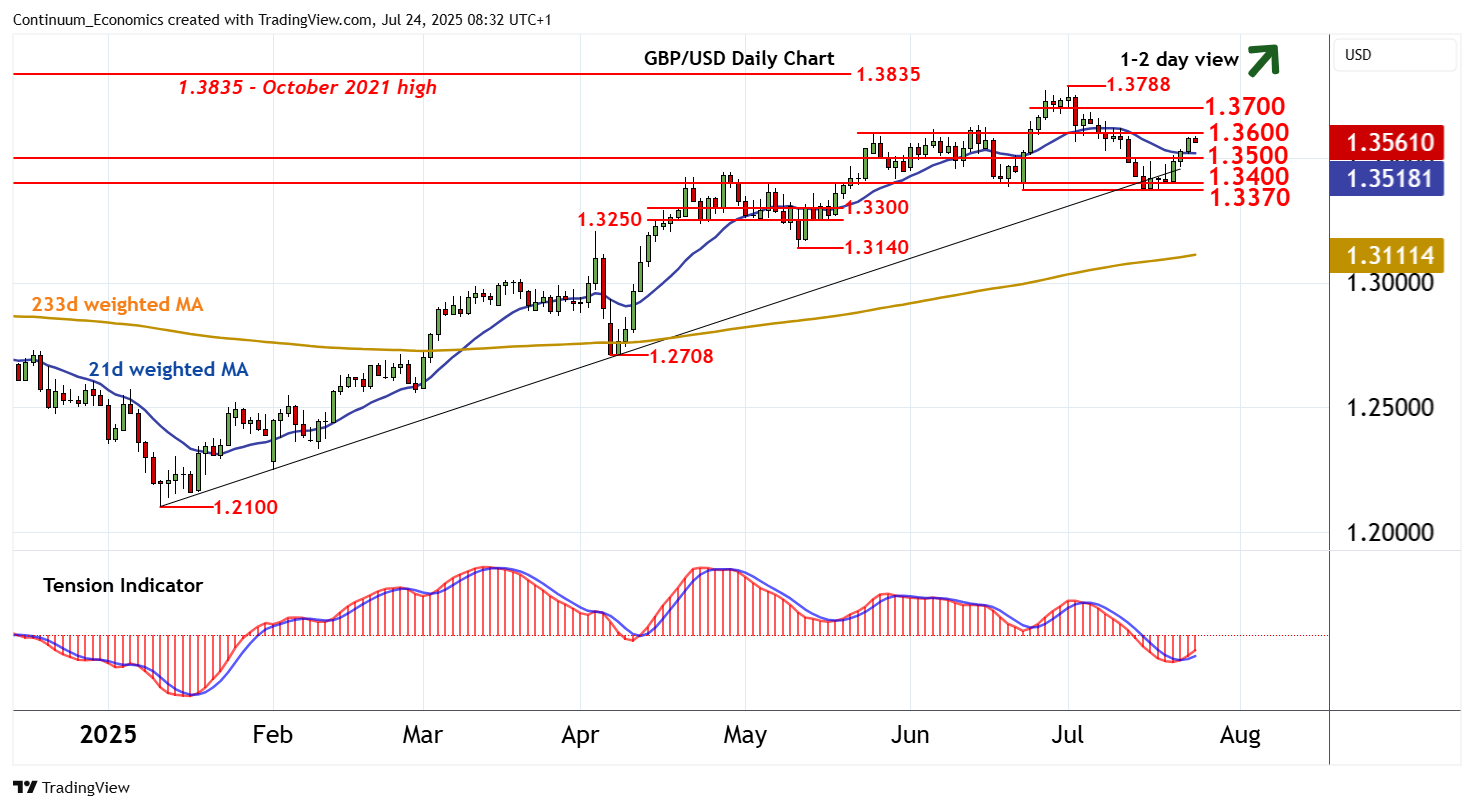
Chart GBP/USD Update: Potential for a test above 1.3600

Anticipated gains are meeting selling interest just beneath congestion resistance at 1.3600
| Level | Comment | Level | Comment | |||||
|---|---|---|---|---|---|---|---|---|
| R4 | 1.3788 | ** | 1 Jul YTD high | S1 | 1.3500 | ** | congestion | |
| R3 | 1.3700 | break level | S2 | 1.3400 | * | congestion | ||
| R2 | 1.3650 | congestion | S3 | 1.3370 | * | 23 Jun (m) low | ||
| R1 | 1.3600 | * | congestion | S4 | 1.3300 | * | congestion |
Asterisk denotes strength of level
08:10 BST - Anticipated gains are meeting selling interest just beneath congestion resistance at 1.3600, as overbought intraday studies unwind, with prices currently trading around 1.3565. Daily stochastics and the daily Tension Indicator are positive, pointing to room for a later break above here. But broader weekly charts continue to track lower, highlighting potential for renewed selling interest towards further congestion around 1.3650. Meanwhile, support remains at congestion around 1.3500. A close beneath here, not yet seen, will turn sentiment neutral once again and prompt consolidation above strong support at the 1.3370 monthly low of 23 June and congestion around 1.3400. A further close beneath here is needed to confirm a near-term top in place at the 1.3788 current year high of 1 July, as prices then extend losses below the rising January trendline, initially opening up a test of congestion around 1.3300.