Published: 2026-05-08T16:02:56.000Z
Chart USD/CAD Update: Reached 1.3700 - daily studies rising
3
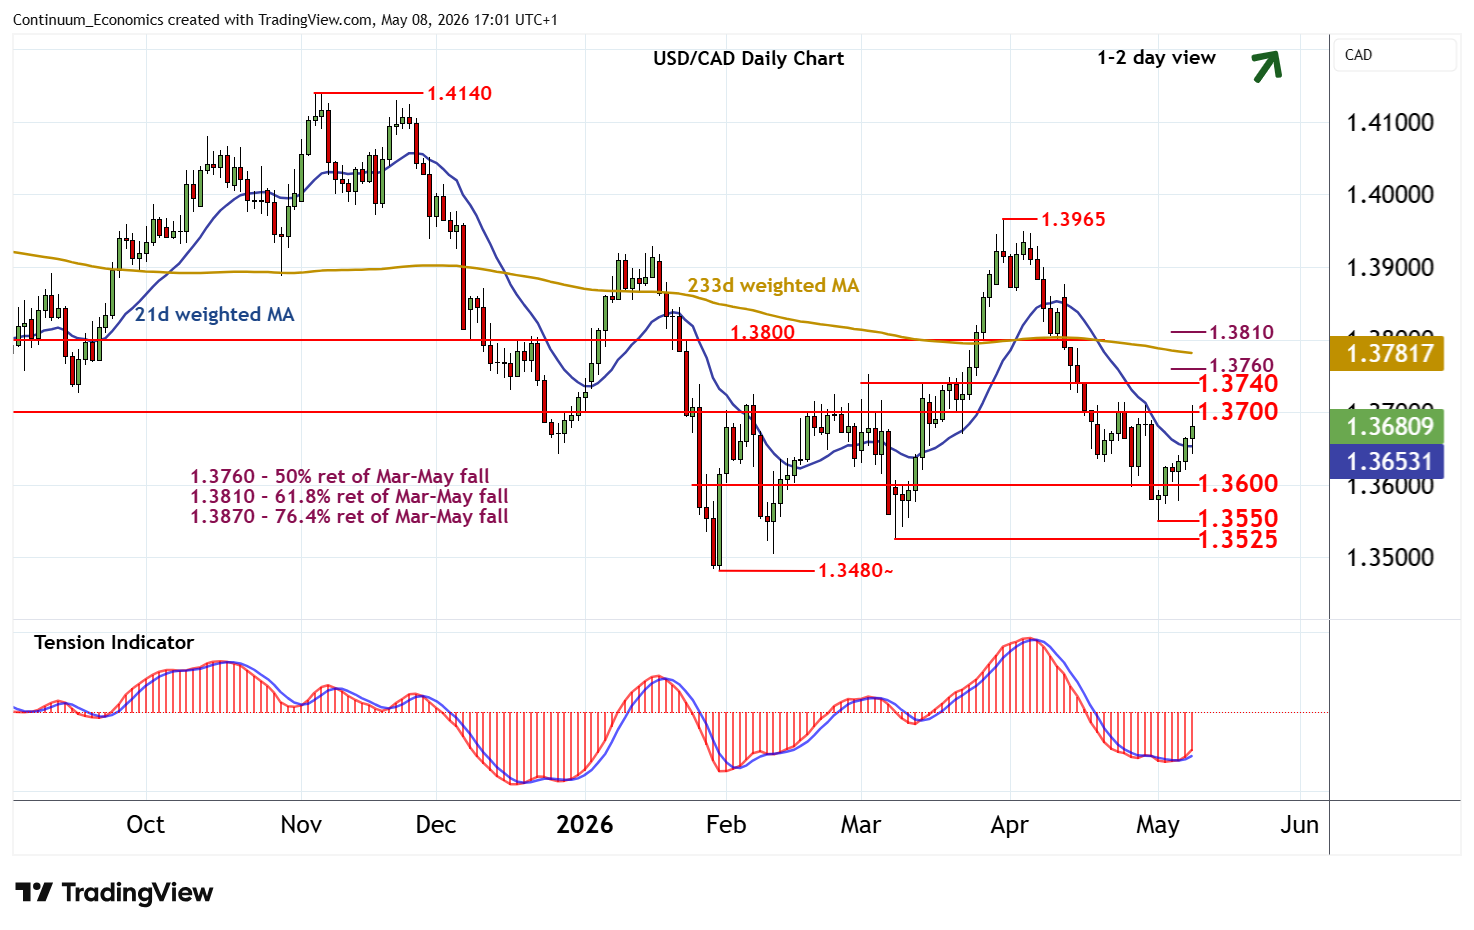
Anticipated gains have reached congestion resistance at 1.3700, where unwinding overbought intraday studies are prompting short-term reactions
| Levels | Imp | Comment | Levels | Imp | Comment | |||
|---|---|---|---|---|---|---|---|---|
| R4 | 1.3800/10 | ** | congestion; 61.8% ret | S1 | 1.3640 | break level | ||
| R3 | 1.3760 | ** | 50% ret of Mar-May fall | S2 | 1.3600 | ** | congestion | |
| R2 | 1.3740 | * | break level | S3 | 1.3550 | * | 1 May (w) low | |
| R1 | 1.3700 | ** | congestion | S4 | 1.3525 | * | 9 Mar (m) low |
Asterisk denotes strength of level
16:45 BST - Anticipated gains have reached congestion resistance at 1.3700, where unwinding overbought intraday studies are prompting short-term reactions. Daily readings continue to rise, pointing to room for a break. But negative weekly charts should limit scope in renewed selling interest towards resistance at the 1.3740 break levels and the 1.3760 Fibonacci retracement. Meanwhile, immediate support is at 1.3640 and extends to congestion around 1.3600. Any immediate pullback should give way to consolidation above here.