Published: 2026-03-31T14:10:38.000Z
Chart AUD/USD Update: Limited tests higher
1
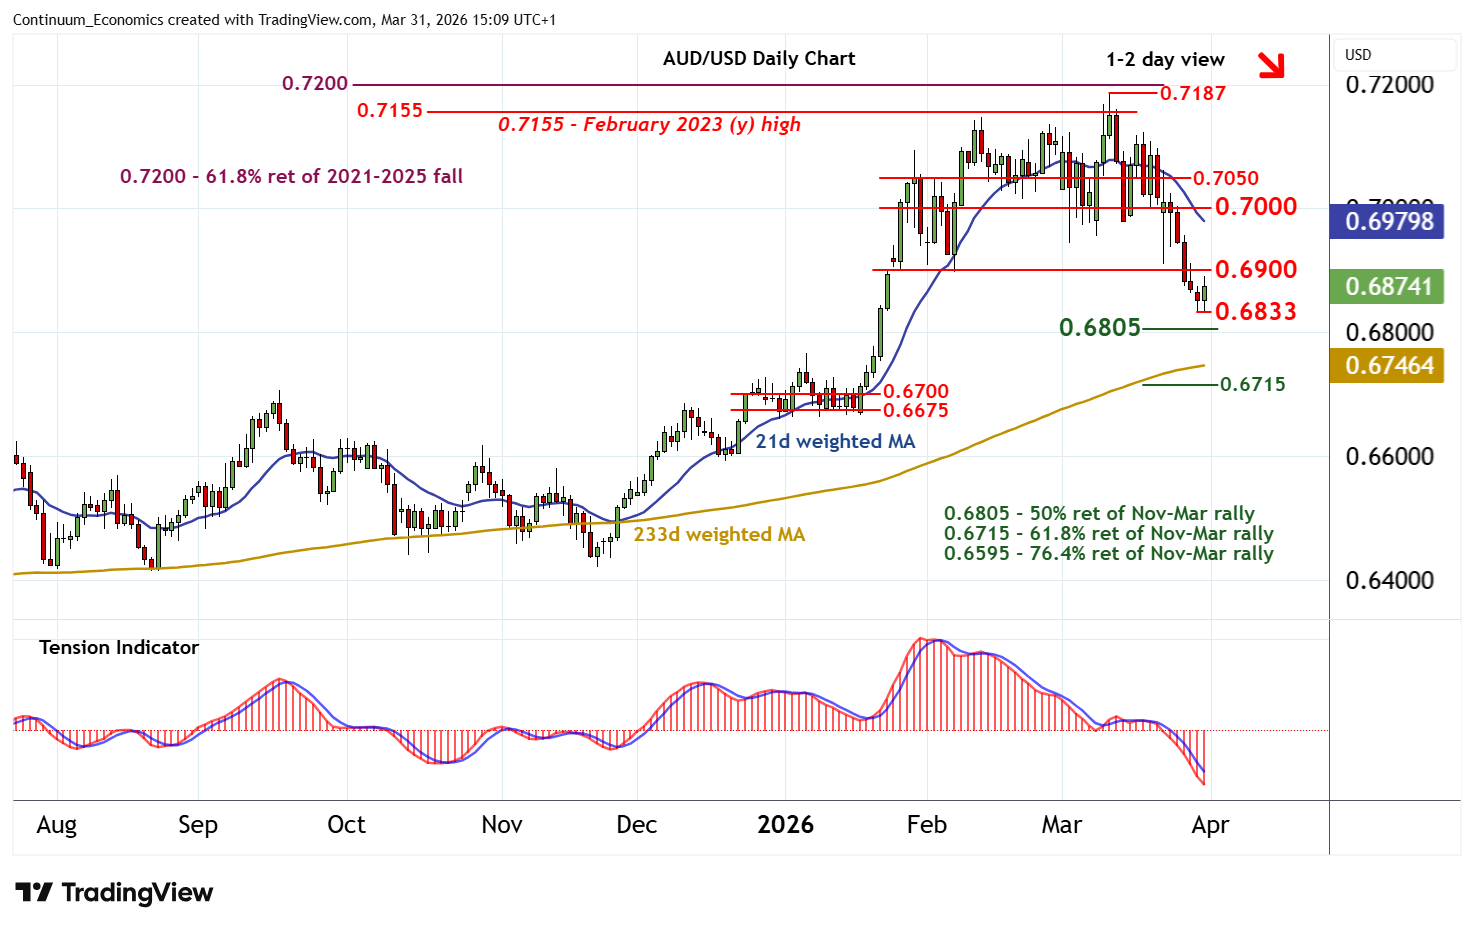
Consolidation above the 0.6833 low of 30 March is giving way to a test higher
| Levels | Imp | Comment | Levels | Imp | Comment | |||
|---|---|---|---|---|---|---|---|---|
| R4 | 0.7100 | break level | S1 | 0.6833 | 30 Mar low | |||
| R3 | 0.7050 | * | congestion | S2 | 0.6805 | ** | 50% ret of Nov-Mar rally | |
| R2 | 0.7000 | * | congestion | S3 | 0.6715 | ** | 61.8% ret of Nov-Mar rally | |
| R1 | 0.6900 | * | break level | S4 | 0.6700 | ** | congestion |
Asterisk denotes strength of level
15:00 BST - Consolidation above the 0.6833 low of 30 March is giving way to a test higher, as intraday studies turn up and oversold daily stochastics flatten, with focus on resistance at 0.6900. A test above here cannot be ruled out. But the negative daily Tension Indicator and bearish weekly charts should limit scope in renewed selling interest beneath congestion resistance at 0.7000. Following cautious/corrective trade, fresh losses are looked for. A later break below 0.6833 will open up the 0.6805 Fibonacci retracement, with room for extension of March losses towards 0.6700/15.