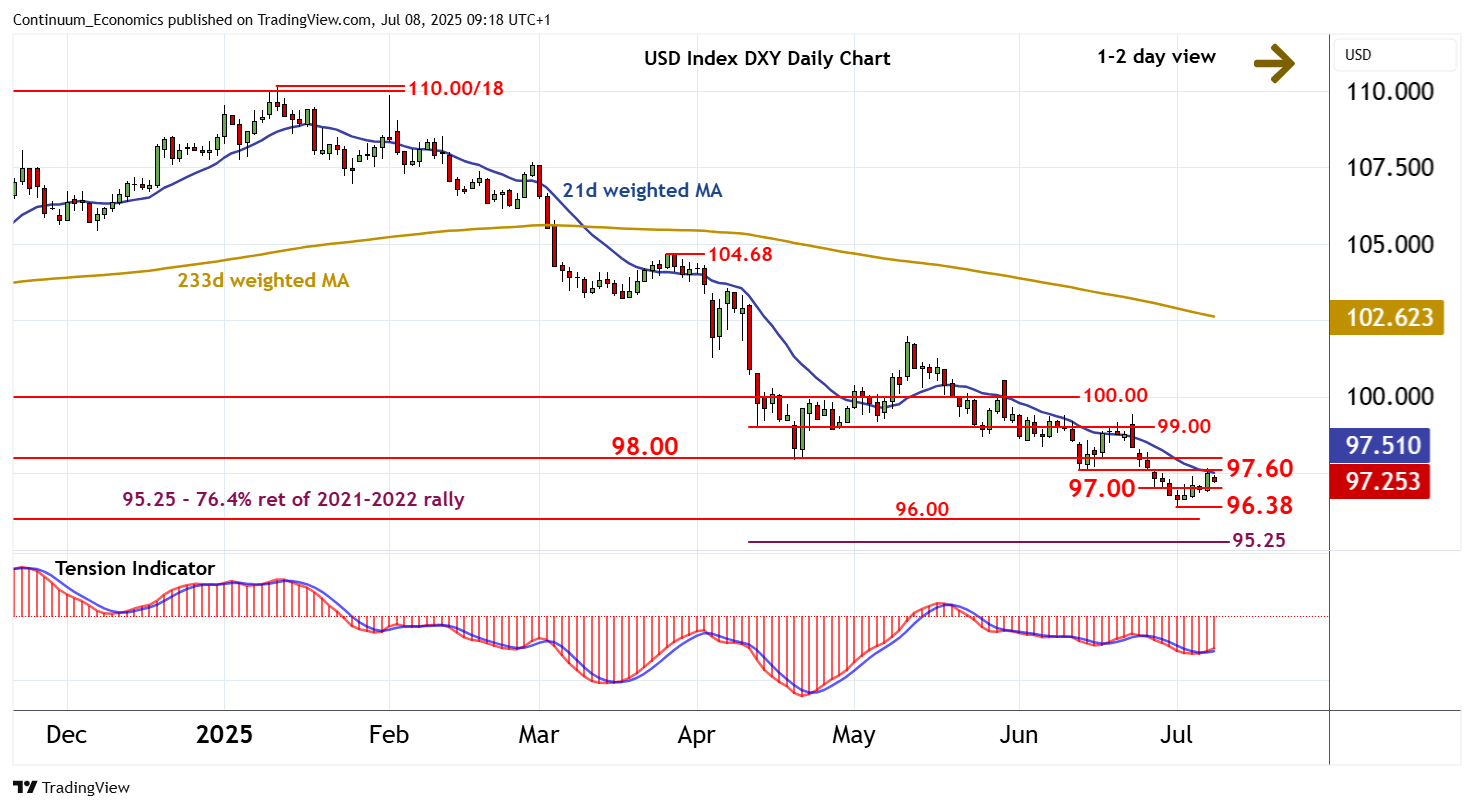
Chart USD Index DXY Update: Back in range

The anticipated test of resistance at the 97.60 weekly low of 12 June has given way to a pullback
| Levels | Imp | Comment | Levels | Imp | Comment | |||
|---|---|---|---|---|---|---|---|---|
| R4 | 99.50 | congestion | S1 | 97.00 | * | congestion | ||
| R3 | 99.00 | break level | S2 | 96.50 | * | congestion | ||
| R2 | 98.00 | * | congestion | S3 | 96.38 | * | 1 Jul YTD low | |
| R1 | 97.60 | * | 12 Jun (w) low | S4 | 96.00 | ** | congestion |
Asterisk denotes strength of level
09:00 BST - The anticipated test of resistance at the 97.60 weekly low of 12 June has given way to a pullback, as overbought intraday studies unwind, with prices currently trading around 97.25. A drift lower to congestion support at 97.00 is highlighted. But rising daily readings are expected to limit any immediate break in consolidation above the 96.38 current year low of 1 July. Weekly charts are negative and longer-term readings are also bearish, pointing to room for a later break beneath here towards congestion around 96.00, with room for extension of September 2022 losses towards the 95.25 Fibonacci retracement. Meanwhile, resistance is at 97.60 and extends to congestion around 98.00. This range should cap any immediate tests higher.