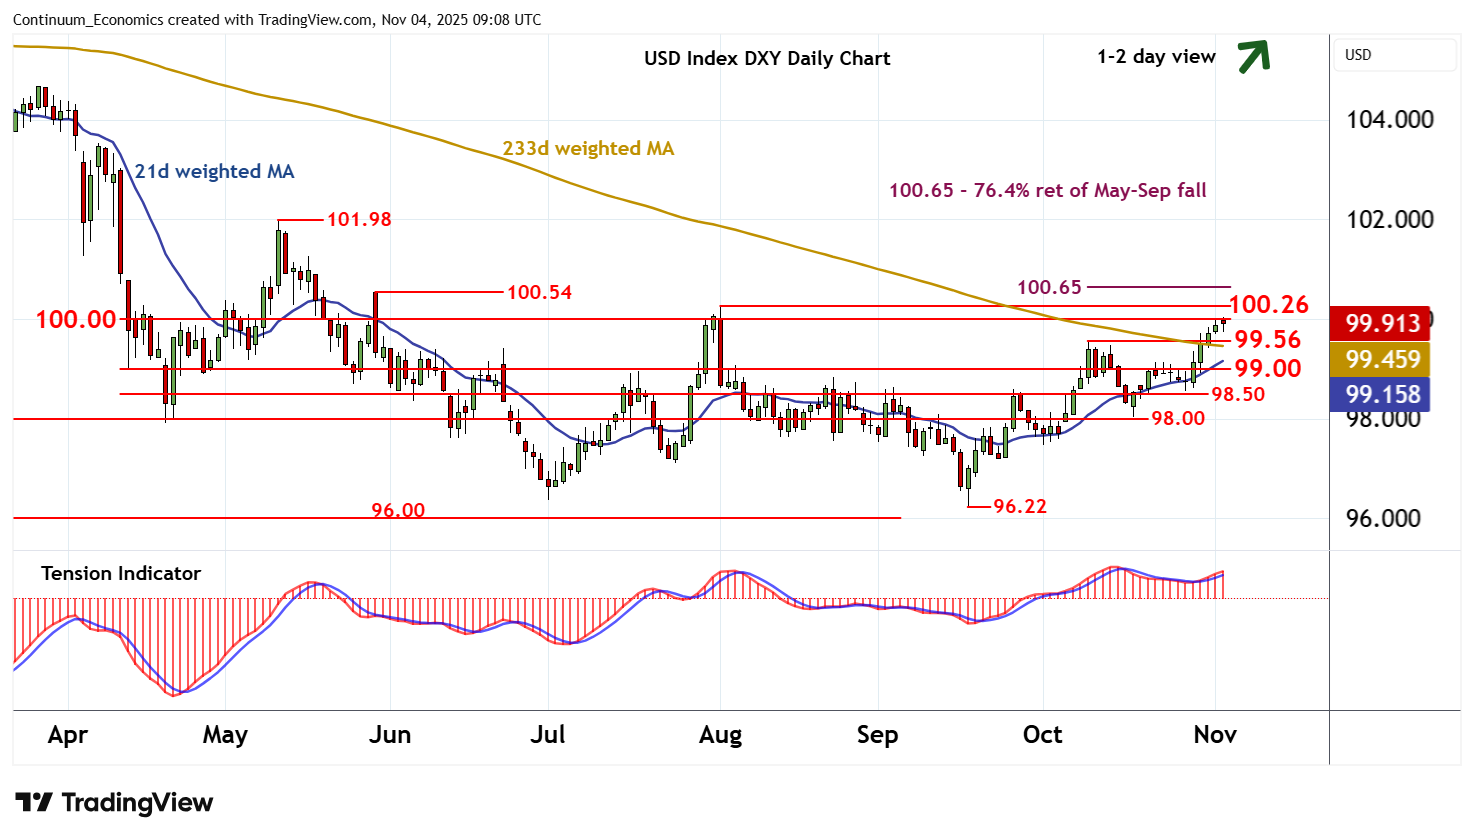
Chart USD Index DXY Update: Consolidating test of strong resistance at 100.00/26
Little change, as mixed intraday studies and flattening overbought daily stochastics prompt consolidation
| Levels | Imp | Comment | Levels | Imp | Comment | |||
|---|---|---|---|---|---|---|---|---|
| R4 | 100.65 | ** | 76.4% ret of May-Sep fall | S1 | 99.56 | ** | 9 Oct (w) high | |
| R3 | 100.54 | ** | 29 May (w) high | S2 | 99.00 | * | congestion | |
| R2 | 100.26 | ** | 1 Aug (m) high | S3 | 98.50 | * | congestion | |
| R1 | 100.00 | ** | congestion | S4 | 98.00 | * | congestion |
Asterisk denotes strength of level
09:00 GMT - Little change, as mixed intraday studies and flattening overbought daily stochastics prompt consolidation, following the test of congestion resistance at 100.00. The daily Tension Indicator continues to rise and broader weekly charts are positive, highlighting room for further strength in the coming sessions. But a close above the 100.26 monthly high of 1 August is needed to improve sentiment and extend mid-September gains initially to the 100.54 weekly high of 29 May and the 100.65 Fibonacci retracement. However, already overbought daily stochastics could limit any initial tests of this range in profit-taking/consolidation. Meanwhile, a close back below the 99.56 weekly high of 9 October would help to stabilise price action and prompt consolidation above congestion support at 99.00.