Published: 2025-06-20T08:15:44.000Z
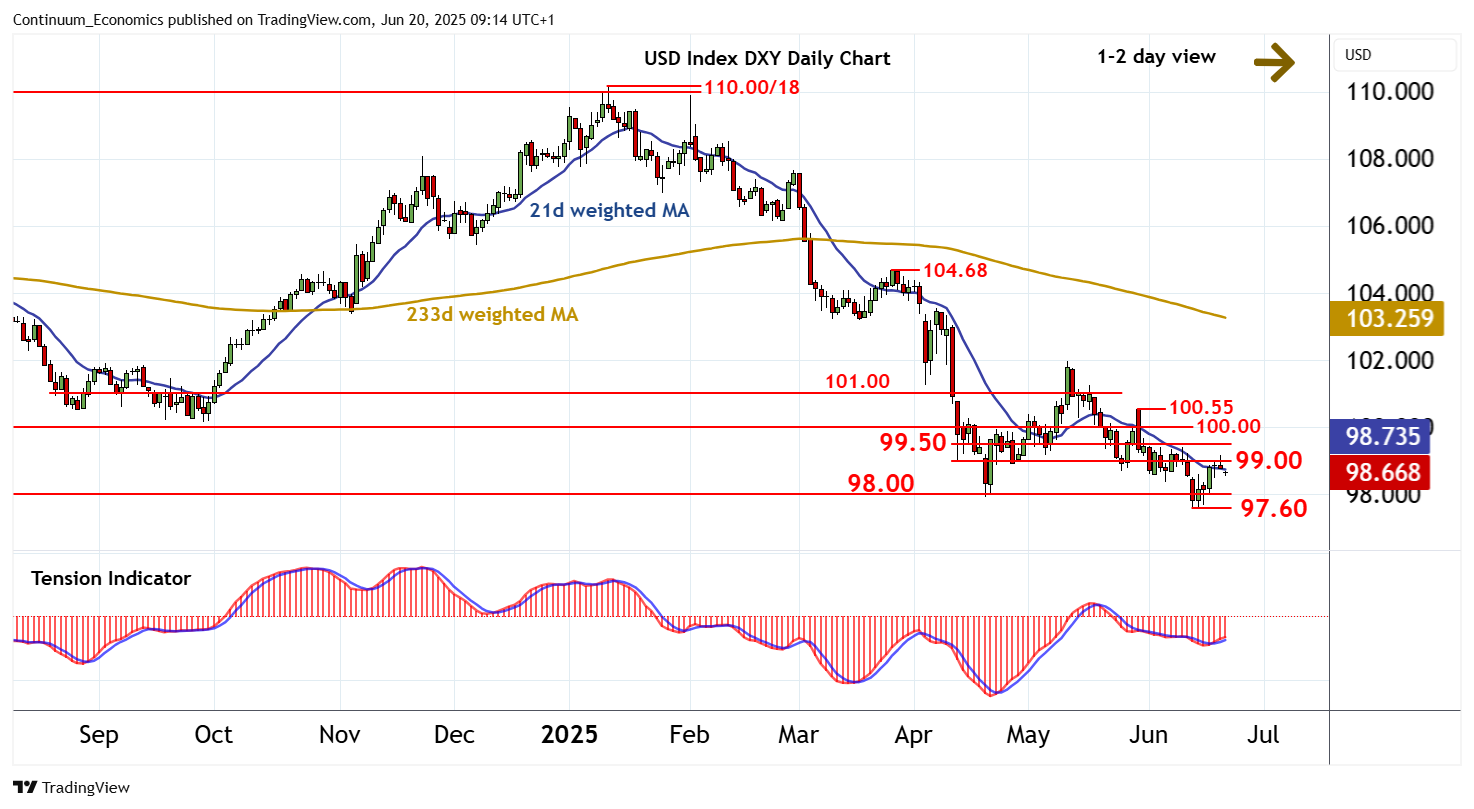
Chart USD Index DXY Update: Downside to remain limited

Senior Technical Strategist
4
Cautious trade around resistance at 99.00 has given way to a pullback
| Levels | Imp | Comment | Levels | Imp | Comment | |||
|---|---|---|---|---|---|---|---|---|
| R4 | 100.55 | * | 29 May (w) high | S1 | 98.00 | * | congestion | |
| R3 | 100.00 | ** | congestion | S2 | 97.70 | * | early-Mar 22 (w) low | |
| R2 | 99.50 | congestion | S3 | 97.60 | * | 12 Jun YTD low | ||
| R1 | 99.00 | break level | S4 | 96.50 | * | congestion |
Asterisk denotes strength of level
09:05 BST - Cautious trade around resistance at 99.00 has given way to a pullback, as intraday studies turn down, with prices currently trading around 98.65. Intraday studies are under pressure and overbought daily stochastics are ticking down, suggesting room for still further losses. Support is at congestion around 98.00. But the positive daily Tension Indicator and improving weekly charts are expected to limit any tests in renewed consolidation. Meanwhile, a close above 99.00, not yet seen, will open up congestion around 99.50. Bearish longer-term charts should limit any tests above here in selling pressure towards 100.00.