Published: 2026-05-15T00:41:13.000Z
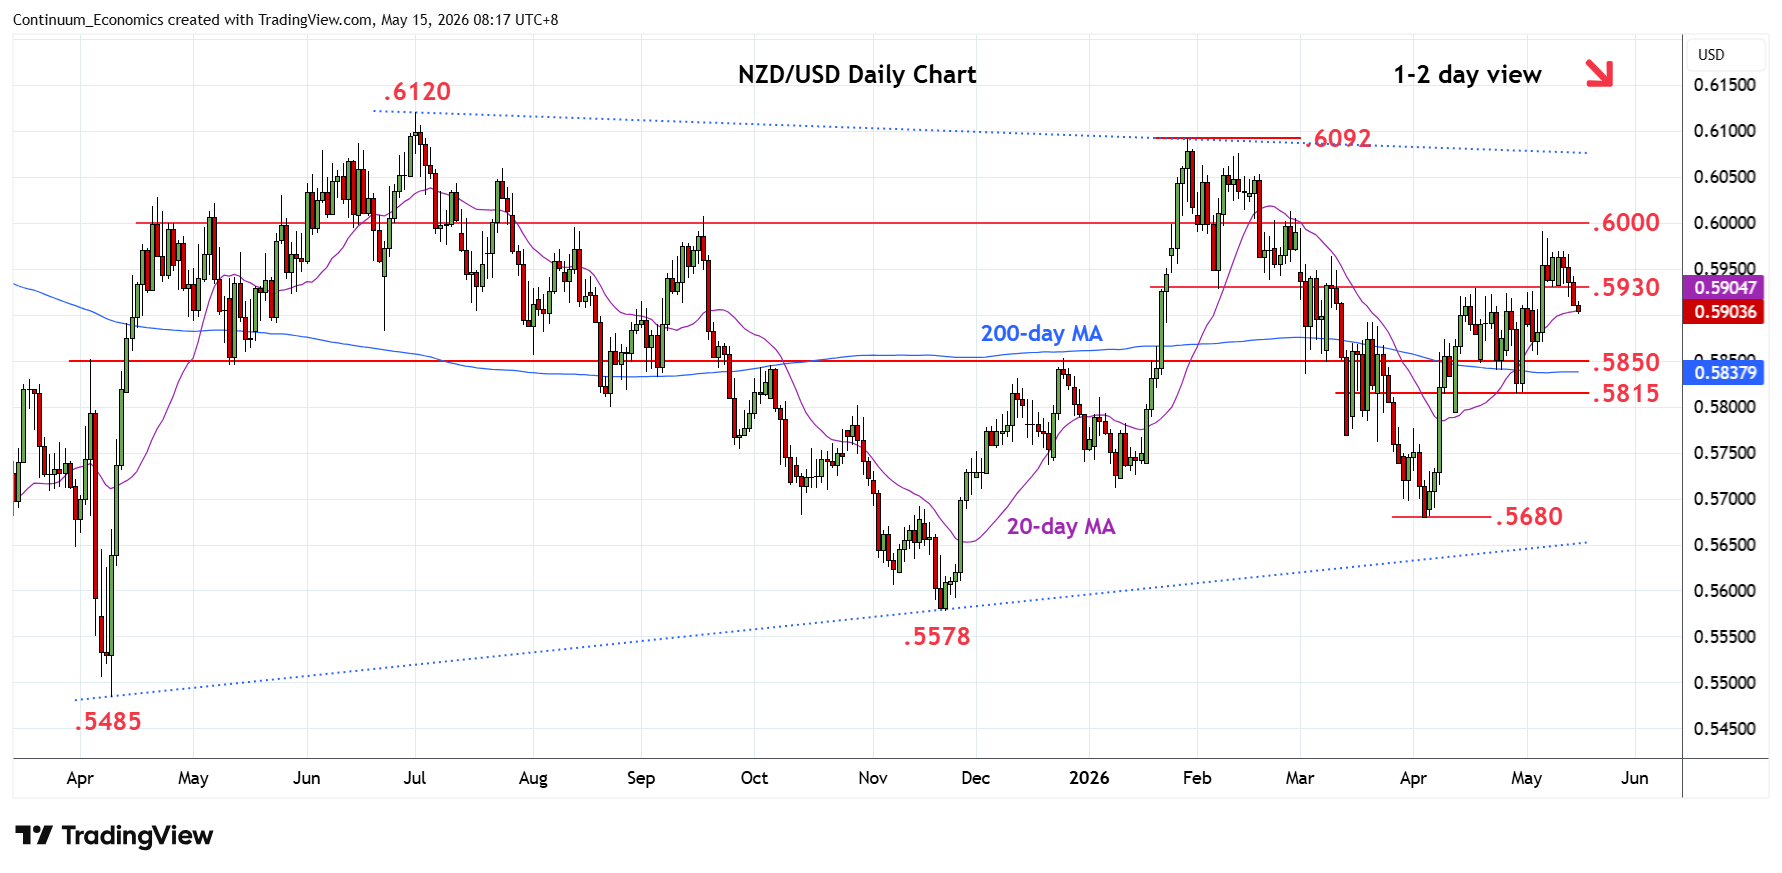
Chart NZD/USD Update: Extending pullback from .5990 high
1
Consolidation above .5930 support has given way to break to pressure the .5900 level
| Levels | Imp | Comment | Levels | Imp | Comment | |||
|---|---|---|---|---|---|---|---|---|
| R4 | .6092 | ** | 29 Jan YTD high | S1 | .5900 | * | congestion | |
| R3 | .6050 | * | congestion | S2 | .5850 | * | congestion | |
| R2 | .5990 | ** | 6 May high | S3 | .5815 | ** | 29 Apr low | |
| R1 | .5930 | * | 8 May low, break | S4 | .5800 | congestion |
Asterisk denotes strength of level
00:30 GMT - Consolidation above .5930 support has given way to break to pressure the .5900 level. Daily studies have turn lower from overbought areas and threatens break here to open up room for deeper pullback to retrace gains from the .5680 April low. Lower will see extension to the .5850 congestion then strong support at .5815 low of 29 April which is expected to underpin. Meanwhile, resistance is lowered to the .5930 previous support which should cap and sustain pullback from the .5990 high.