Published: 2026-03-05T07:23:25.000Z
Chart AUD/NZD Update: Leaning lower from 1.1980 high
1
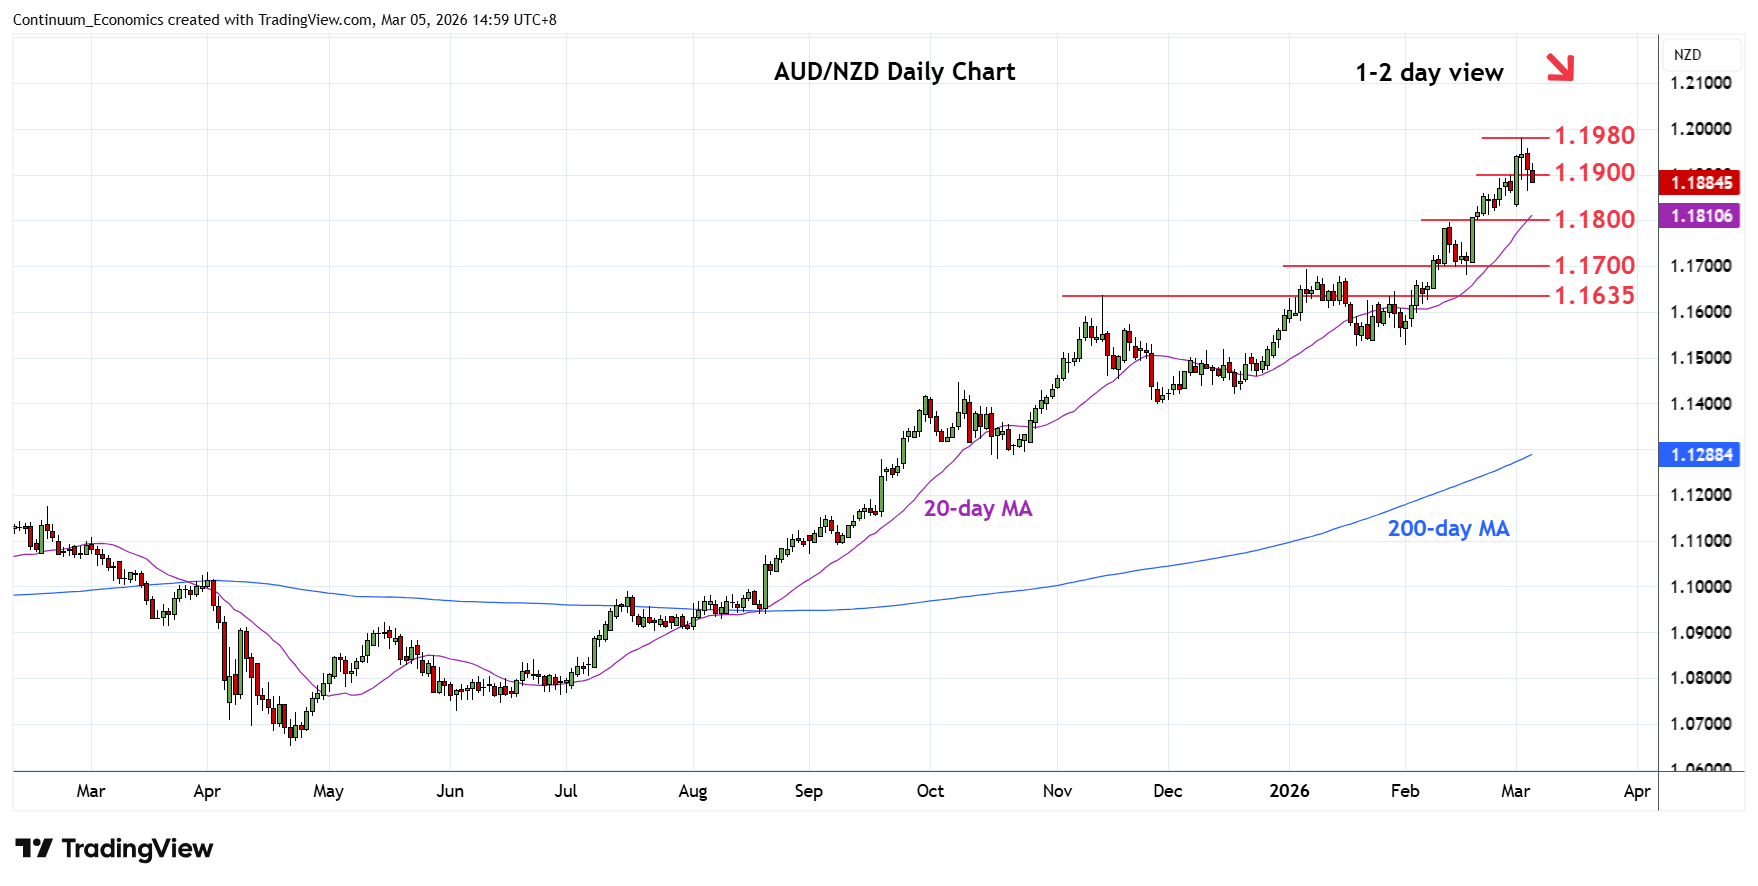
Extending rejection from the 1.1980 high of last week as prices unwind overbought daily and weekly studies
| Level | Comment | Level | Comment | |||||
|---|---|---|---|---|---|---|---|---|
| R4 | 1.2100 | * | Jun 2013 high | S1 | 1.1800 | * | congestion | |
| R3 | 1.2000 | * | figure, congestion | S2 | 1.1760 | * | 38.2% Nov/Mar rally | |
| R2 | 1.1980 | ** | 3 Mar YTD high | S3 | 1.1700/80 | ** | congestion, 17 Feb low | |
| R1 | 1.1900 | * | congestion | S4 | 1.1635 | ** | Nov high |
Asterisk denotes strength of level
07:10 GMT - Extending rejection from the 1.1980 high of last week as prices unwind overbought daily and weekly studies. Below the 1.1900 level opens up room for deeper pullback to retrace strong gains from the November low to the 1.1800 level and 1.1760, 38.2% Fibonacci level. Lower still, will see room to strong support at the 1.1700/1.1680 area and 1.1635, November high. Meanwhile, resistance at the 1.1980 current year high is expected to cap. Clearance will further extend the underlying bull trend from 2020 year low.