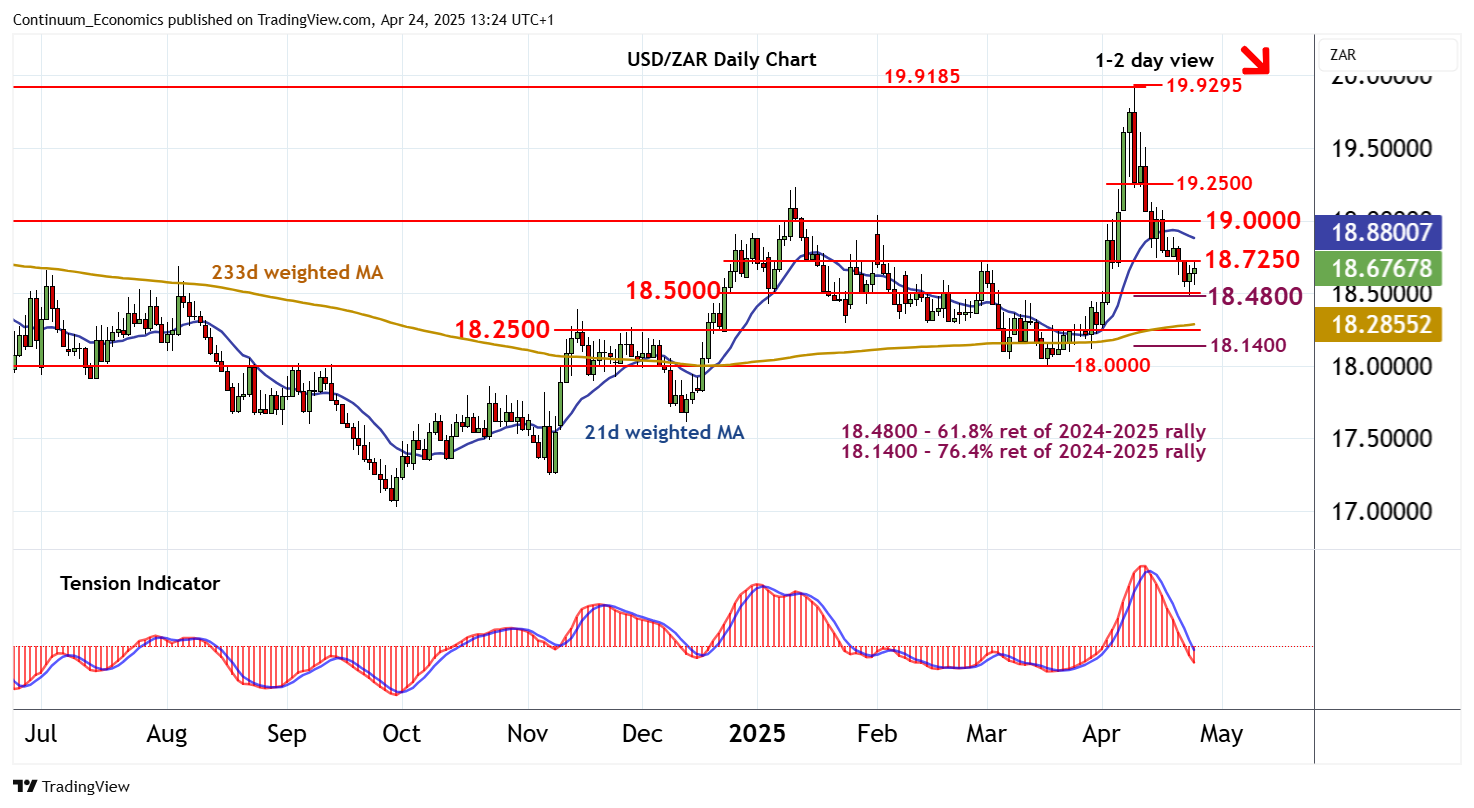
Chart USD/ZAR Update: Limited tests higher

The anticipated bounce following the test of support at the 18.4800 Fibonacci retracement and the 18.5000 break level is currently pressuring congestion resistance at 18.7250
| Level | Comment | Level | Comment | |||||
|---|---|---|---|---|---|---|---|---|
| R4 | 19.5000 | congestion | S1 | 18.5000 | ** | break level | ||
| R3 | 19.2500 | break level | S2 | 18.4800 | ** | 61.8% ret of 2024-2025 rally | ||
| R2 | 19.0000 | ** | congestion | S3 | 18.2500 | * | congestion | |
| R1 | 18.7250 | * | congestion | S4 | 18.1400 | ** | 76.4% ret of 2024-2025 rally |
Asterisk denotes strength of level
13:10 BST - The anticipated bounce following the test of support at the 18.4800 Fibonacci retracement and the 18.5000 break level is currently pressuring congestion resistance at 18.7250. Rising intraday studies and flattening oversold daily stochastics highlight potential for a test above here. But the bearish daily Tension Indicator and mixed/negative weekly charts are expected to limit scope in renewed consolidation beneath congestion around 19.0000. Following corrective trade, fresh losses are looked for. However, a close below 18.4800 - 18.5000 is needed to add weight to sentiment and extend April losses towards congestion around 18.2500.