Published: 2026-03-04T00:48:49.000Z
Chart NZD/USD Update: Under pressure
1
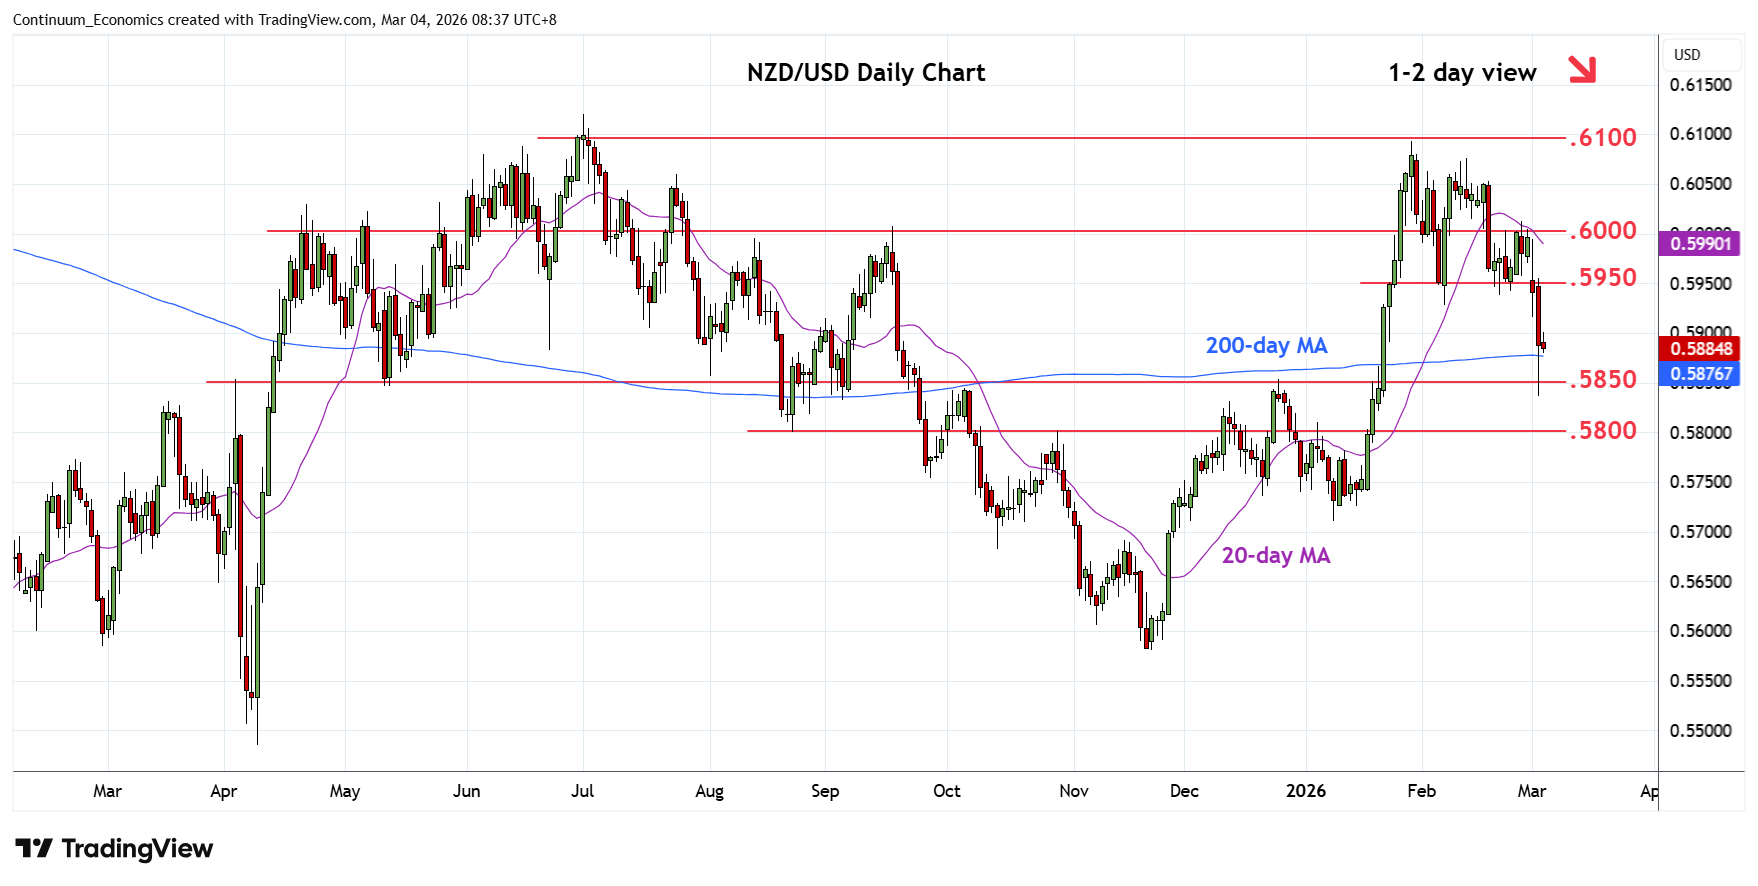
Sharply lower following break of support at the .5950 congestion with losses reaching the .5836, 50% Fibonacci retracement
| Levels | Imp | Comment | Levels | Imp | Comment | |||
|---|---|---|---|---|---|---|---|---|
| R4 | .6050 | * | congestion | S1 | .5850 | * | Dec high, congestion | |
| R3 | .6000 | ** | figure, congestion | S2 | .5836 | * | 3 Mar low, 50% | |
| R2 | .5950 | ** | congestion | S3 | .5800 | ** | congestion | |
| R1 | .5900 | * | congestion | S4 | .5775 | * | 61.8% Nov/Jan rally |
Asterisk denotes strength of level
00:40 GMT - Sharply lower following break of support at the .5950 congestion with losses reaching the .5836, 50% Fibonacci retracement. Subsequent bounce see prices unwinding oversold intraday studies but negative daily and weekly studies keeps pressure on the downside and see room for retest of the .5850/.5836 area. Below this, will open up room to the strong support at the .5800 level and .5775, 61.8% Fibonacci level. Meanwhile, resistance at the .5950/.6000 congestion is expected to cap and sustain losses from the .6093, 29 January current year high.