Published: 2026-01-19T09:18:42.000Z
Chart USD Index DXY Update: Choppy in range
2
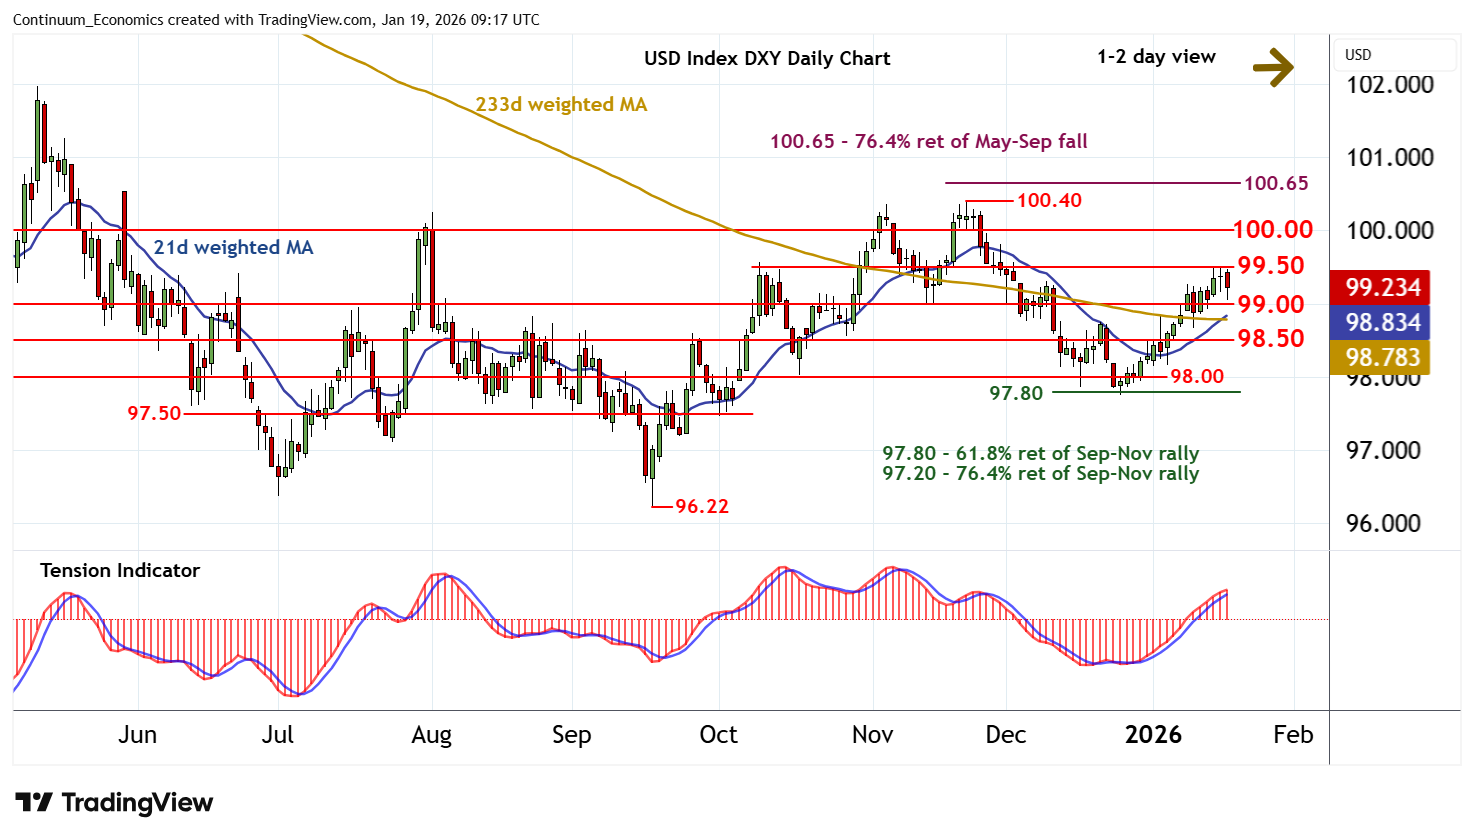
Consolidation following the test of resistance at 99.50 has given way to a choppy pullback
| Levels | Imp | Comment | Levels | Imp | Comment | |||
|---|---|---|---|---|---|---|---|---|
| R4 | 100.65 | ** | 76.4% ret of May-Sep fall | S1 | 99.00 | * | congestion | |
| R3 | 100.40 | ** | 21 Nov (m) high | S2 | 98.50 | * | congestion | |
| R2 | 100.00 | ** | congestion | S3 | 98.00 | * | congestion | |
| R1 | 99.50 | * | break level | S4 | 97.80 | ** | 61.8% ret of Sep-Nov rally |
Asterisk denotes strength of level
09:05 GMT - Consolidation following the test of resistance at 99.50 has given way to a choppy pullback, with prices currently balanced around 99.15. Negative intraday studies and a tick lower in overbought daily stochastics highlight room for a test of congestion support at 99.00. But the positive daily Tension Indicator and mixed weekly charts are expected to limit any immediate break in renewed consolidation above further congestion around 98.50. Meanwhile, resistance remains at 99.50. A break above here, if seen, should be limited in profit-taking towards congestion around 100.00.