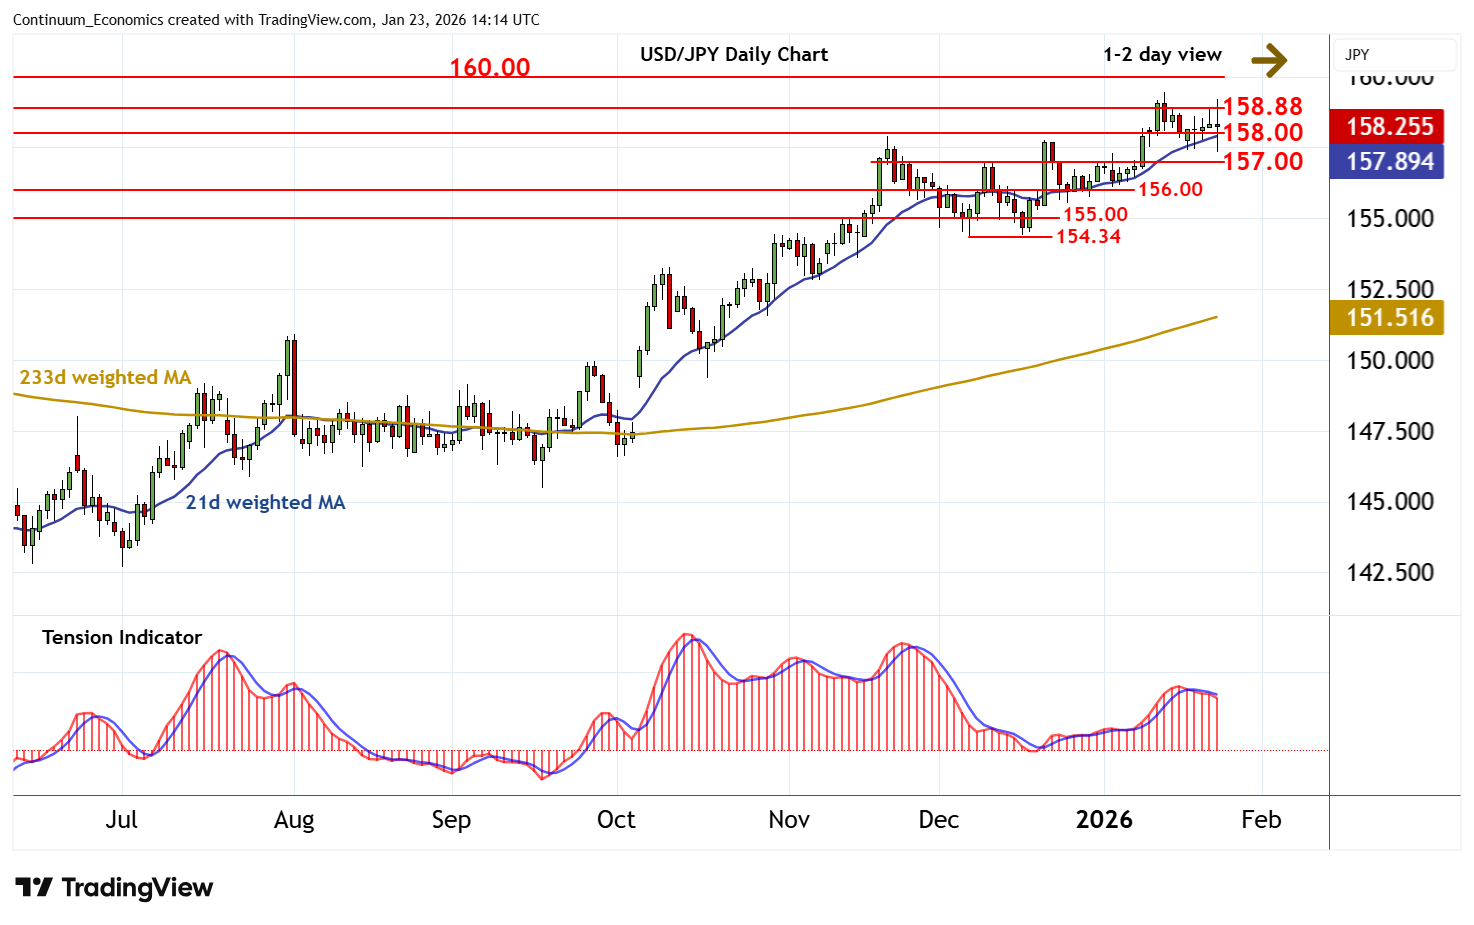
Chart USD/JPY Update: Consolidating recent JPY-driven volatility
The anticipated test above the 158.88 year high of 10 January 2025 has been pushed back in highly volatile JPY-driven trade
| Levels | Imp | Comment | Levels | Imp | Comment | |||
|---|---|---|---|---|---|---|---|---|
| R4 | 161.95 | ** | July 2024 multi-year high | S1 | 158.00 | * | break level | |
| R3 | 160.00 | ** | congestion | S2 | 157.00 | congestion | ||
| R2 | 159.45 | * | 14 Jan YTD high | S3 | 156.00 | * | congestion | |
| R1 | 158.88 | ** | 10 Jan 2025 (y) high | S4 | 155.00 | * | break level |
Asterisk denotes strength of level
13:40 GMT - The anticipated test above the 158.88 year high of 10 January 2025 has been pushed back in highly volatile JPY-driven trade, with prices reaching 157.30/35 before bouncing into consolidation around 158.25. Intraday studies have turned down and daily readings are mixed/negative, suggesting room for fresh losses in the coming sessions. A close below 158.00 will add weight to sentiment and open up congestion around 157.00. But mixed weekly charts should limit any initial tests in fresh consolidation. Meanwhile, a close above 158.88 would improve sentiment and extend multi-year gains beyond the 159.45 current year high of 14 January towards 160.00.