Published: 2025-06-24T15:52:39.000Z
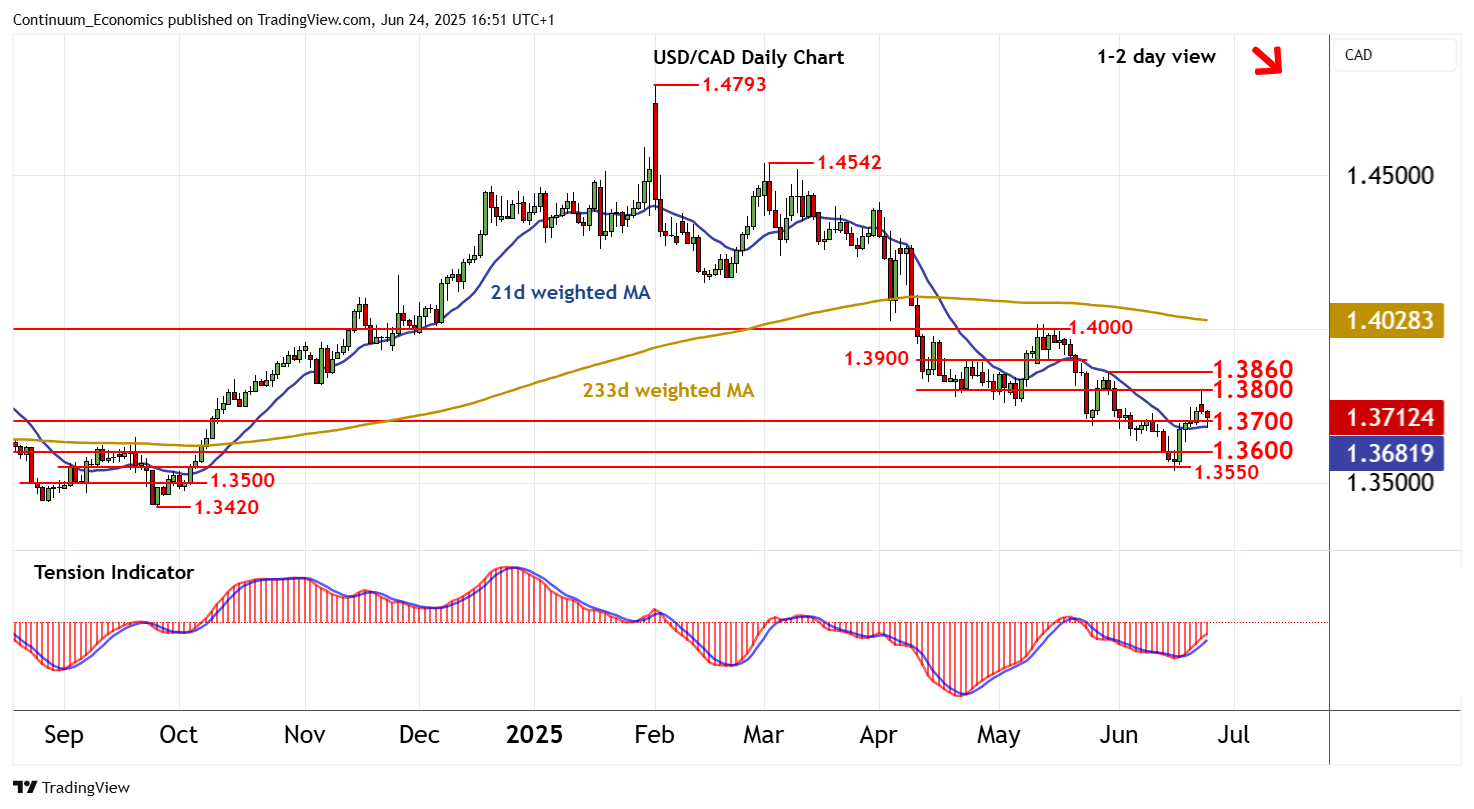
Chart USD/CAD Update: Potential for a retest below 1.3700

Senior Technical Strategist
3
Anticipated losses have tested below congestion around 1.3700
| Levels | Imp | Comment | Levels | Imp | Comment | |||
|---|---|---|---|---|---|---|---|---|
| R4 | 1.4000 | ** | congestion | S1 | 1.3700 | ** | congestion | |
| R3 | 1.3900 | * | congestion | S2 | 1.3600 | ** | congestion | |
| R2 | 1.3860 | * | 29 May (w) high | S3 | 1.3550 | * | congestion | |
| R1 | 1.3800 | congestion | S4 | 1.3500 | * | congestion |
Asterisk denotes strength of level
16:30 BST - Anticipated losses have tested below congestion around 1.3700, with prices reaching 1.3680~ before bouncing back above 1.3700. Overbought daily stochastics are turning down, highlighting room for a retest beneath here. But the rising daily Tension Indicator and positive weekly charts are expected to limit any break in renewed buying interest above further congestion around 1.3600. Following corrective trade, fresh gains are looked for. A later break above congestion resistance at 1.3800 will improve price action and open up the 1.3860 weekly high of 29 May.