Published: 2025-02-20T11:31:04.000Z
Chart USD/ZAR Update: Consolidating

Senior Technical Strategist
-
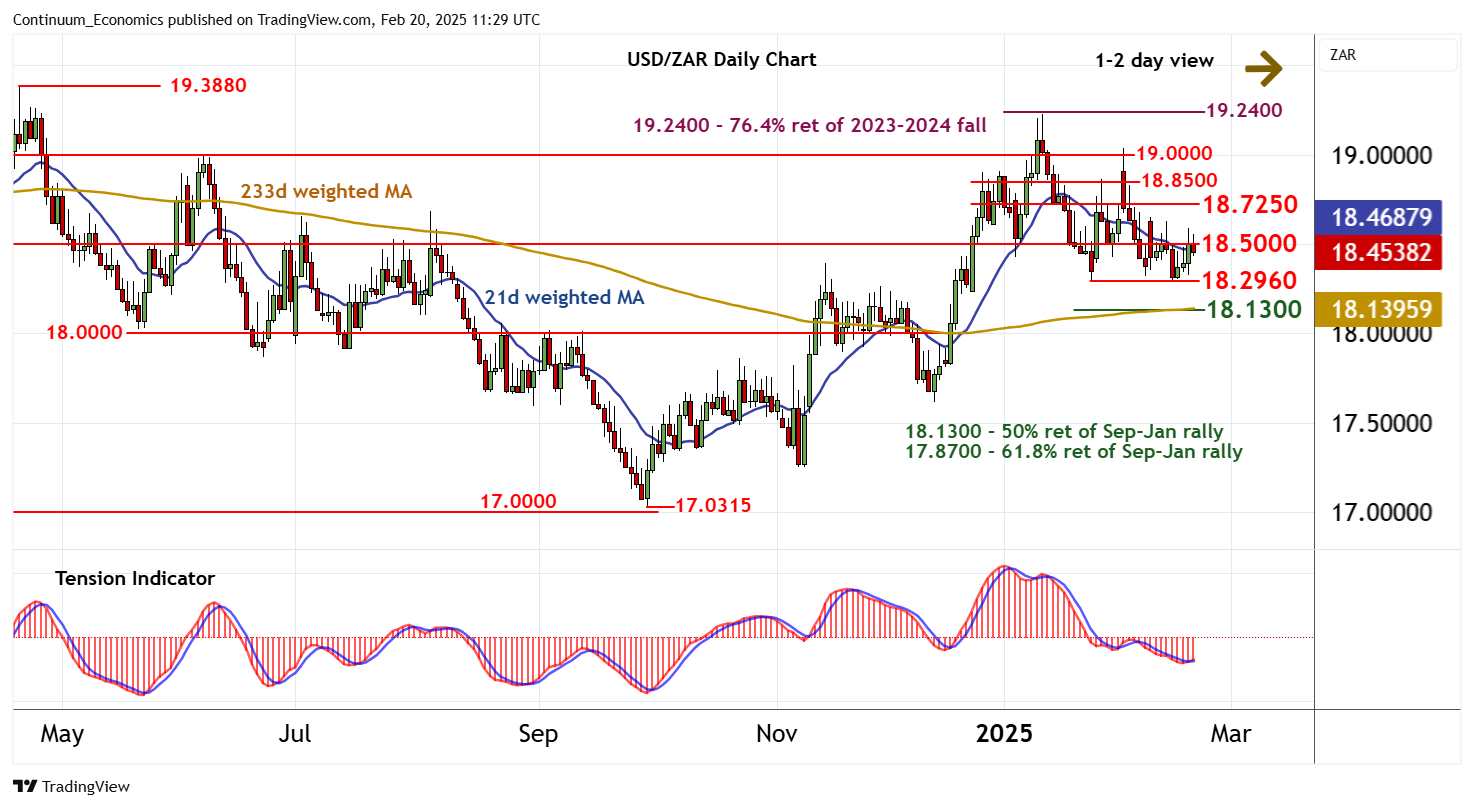
Little change, as prices extend pressure on resistance at the 18.5000 break level
| Level | Comment | Level | Comment | |||||
|---|---|---|---|---|---|---|---|---|
| R4 | 19.0000 | ** | congestion | S1 | 18.2960 | * | 24 Jan YTD low | |
| R3 | 18.8500 | break level | S2 | 18.1300 | * | 50% ret of Sep-Jan rally | ||
| R2 | 18.7250 | * | congestion | S3 | 18.0000 | ** | congestion | |
| R1 | 18.5000 | ** | break level | S4 | 17.8700 | ** | 61.8% ret of Sep-Jan rally |
Asterisk denotes strength of level
11:00 GMT - Little change, as prices extend pressure on resistance at the 18.5000 break level. Intraday studies are leaning lower, highlighting room for a minor pullback. But mixed daily readings are expected to limit initial scope to consolidation above support at the 18.2960 current year low of 24 January, before negative weekly charts extend losses still further. A later close beneath here will add weight to sentiment and extend January losses initially to the 18.1300 Fibonacci retracement. Meanwhile, any tests above 18.5000 are expected to meet renewed selling interest beneath congestion around 18.7250.