Published: 2026-03-04T07:41:30.000Z
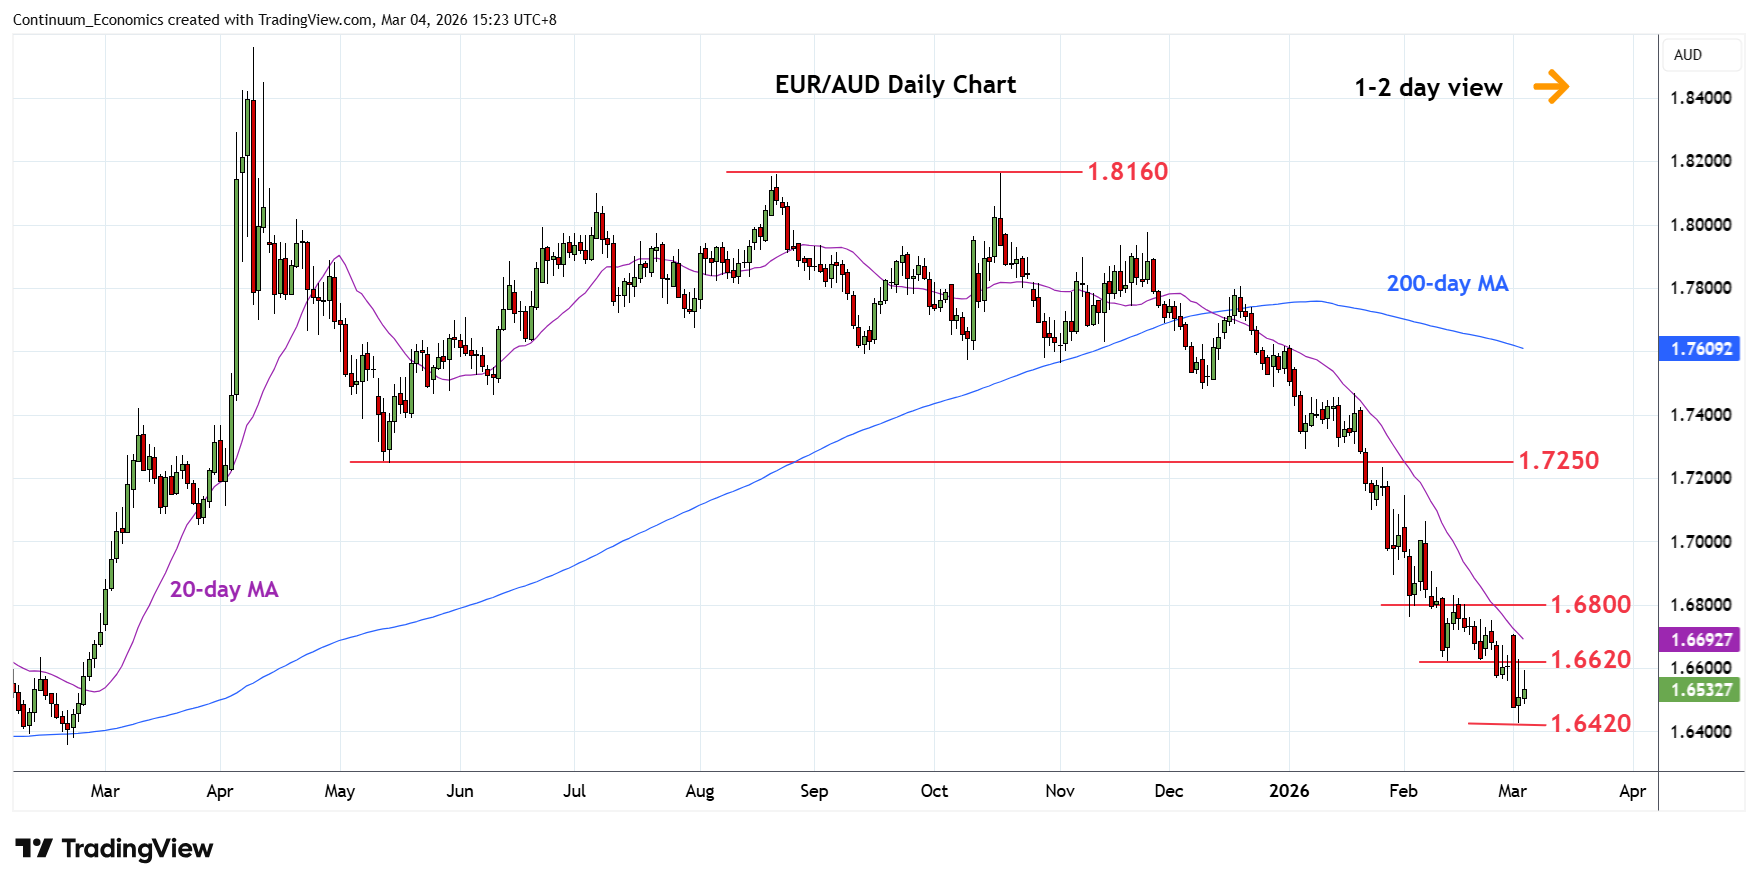
Chart EUR/AUD Update: Range-bound in consolidation
2
Turned up in range from the 1.6420 low and 50% Fibonacci level as prices unwind oversold intraday studies
| Levels | Imp | Comment | Levels | Imp | Comment | |||
|---|---|---|---|---|---|---|---|---|
| R4 | 1.6900 | * | congestion | S1 | 1.6420 | ** | 3 Mar YTD low, 50% | |
| R3 | 1.6800 | * | congestion | S2 | 1.6360 | ** | 20 Feb 2025 year low | |
| R2 | 1.6700/50 | * | congestion | S3 | 1.6300 | * | congestion | |
| R1 | 1.6620 | * | 12 Feb low | S4 | 1.6200 | * | congestion |
Asterisk denotes strength of level
07:30 GMT - Turned up in range from the 1.6420 low and 50% Fibonacci level as prices unwind oversold intraday studies. Shallow bounce keep pressure on the downside but oversold daily and weekly studies suggest consolidation likely to extend before giving way to renewed selling pressure later. Lower will see room to 1.6360 support and the 1.6300 congestion. Would need lift over resistance at 1.6620 to open up room for stronger corrective bounce to resistance at the 1.6700/50 area and the 1.6800/1.6900 congestion.