Chart USD Index DXY Update: Consolidating - studies under pressure
Little change, as mixed intraday studies keep near-term sentiment cautious
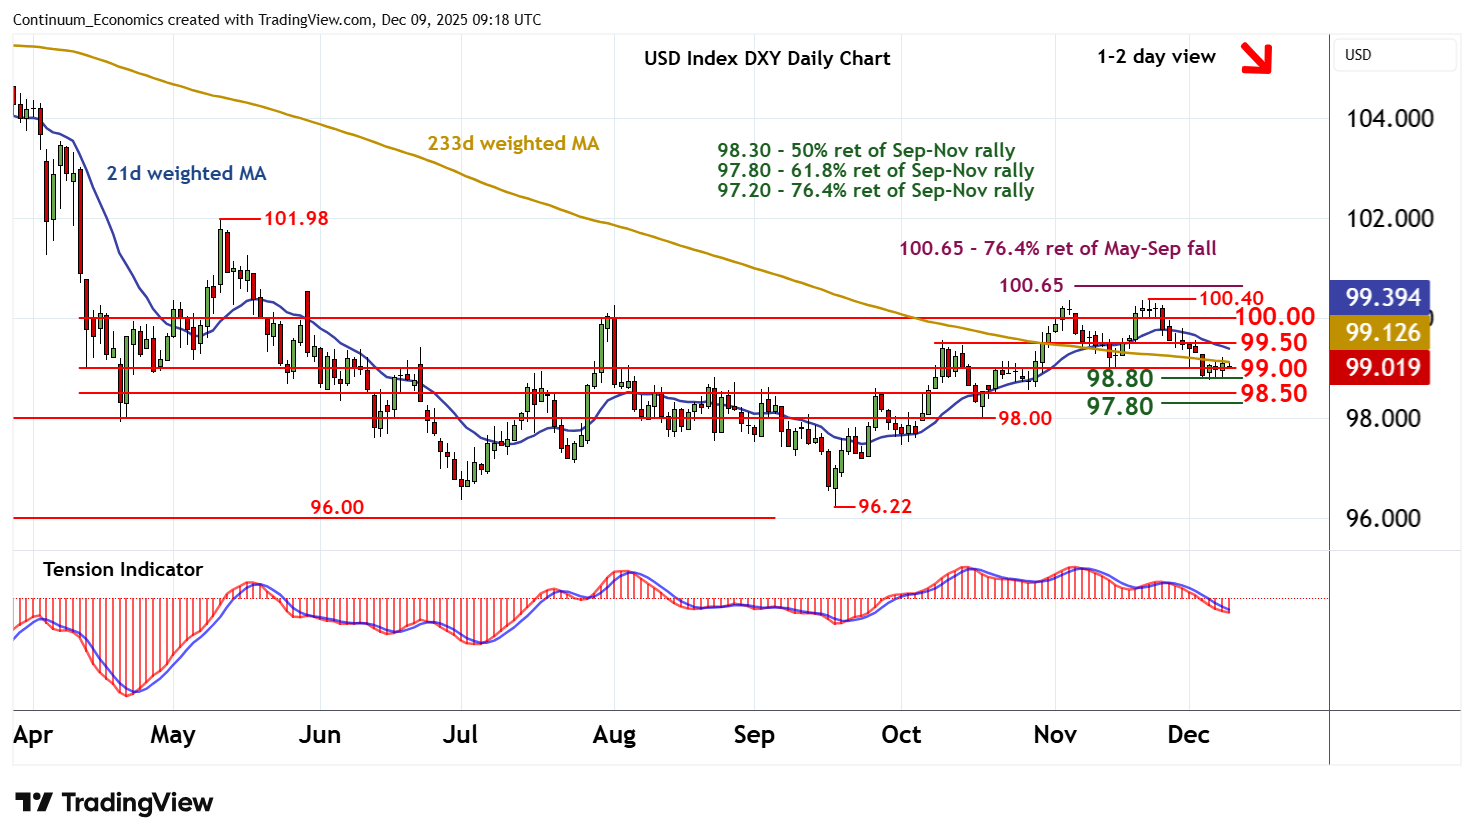
| Levels | Imp | Comment | Levels | Imp | Comment | |||
|---|---|---|---|---|---|---|---|---|
| R4 | 100.65 | ** | 76.4% ret of May-Sep fall | S1 | 99.00 | * | congestion | |
| R3 | 100.40 | ** | 21 Nov (m) high | S2 | 98.80 | * | 38.2% ret of Sep-Nov rally | |
| R2 | 100.00 | ** | congestion | S3 | 98.50 | * | congestion | |
| R1 | 99.50 | * | break level | S4 | 98.30 | ** | 50% ret of Sep-Nov rally |
Asterisk denotes strength of level
09:05 GMT - Little change, as mixed intraday studies keep near-term sentiment cautious and extend consolidation following the test of support at the 98.80 Fibonacci retracement and congestion around 99.00. Daily readings are mixed/negative and broader weekly charts are under pressure, highlighting a deterioration in sentiment and room for further losses in the coming sessions. A break below 98.80 will add weight to already bearish sentiment, and extend late-November losses towards congestion around 98.50. Just lower is the 98.30 retracement, where already oversold daily stochastics could prompt short-covering/consolidation. Meanwhile, resistance is up to the 99.50 break level, and should cap any immediate tests higher.