Published: 2026-04-16T00:22:32.000Z
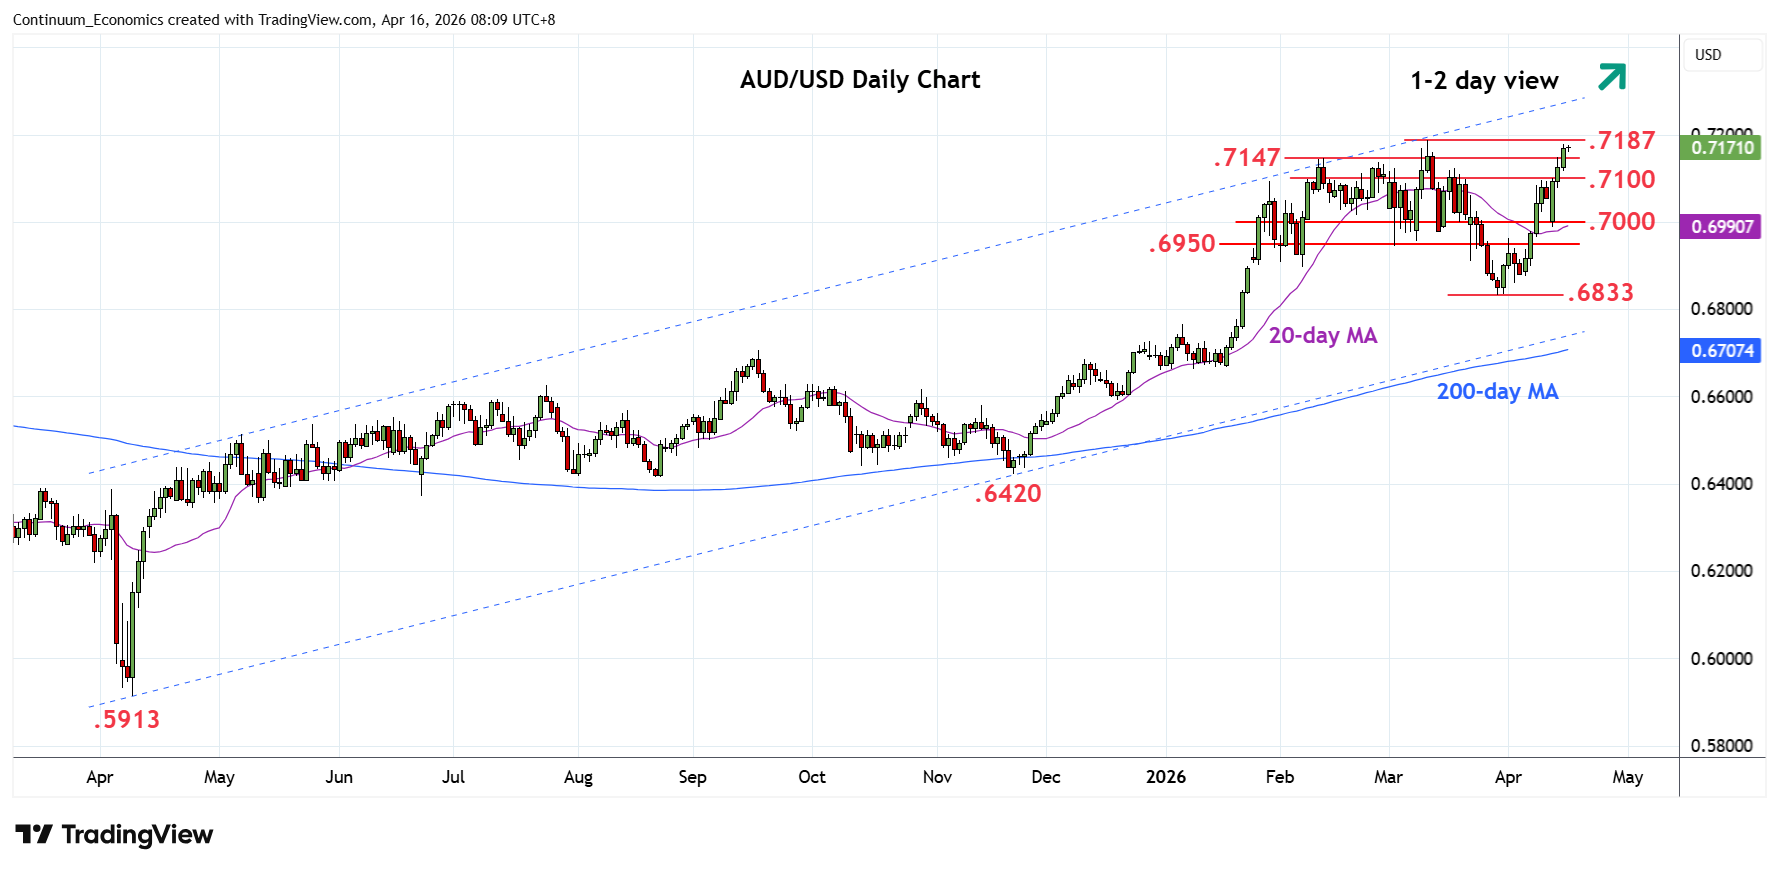
Chart AUD/USD Update: Just shy of March YTD high
2
Break of the .7147 February high see prices within reach of the .7187, 11 March current year high
| Levels | Imp | Comment | Levels | Imp | Comment | |||
|---|---|---|---|---|---|---|---|---|
| R4 | 0.7300 | * | congestion | S1 | 0.7100 | * | congestion | |
| R3 | 0.7280 | * | Jun 2022 high | S2 | 0.7050 | * | congestion | |
| R2 | 0.7210 | * | 61.8% 2021/2025 fall | S3 | 0.7000 | ** | figure, congestion | |
| R1 | 0.7187 | ** | 11 Mar YTD high | S4 | 0.6950 | ** | congestion |
Asterisk denotes strength of level
00:15 GMT - Break of the .7147 February high see prices within reach of the .7187, 11 March current year high. Reaction here can be expected as intraday and daily studies stretches into overbought areas. A later break here will see room to extend the underlying bull trend from the April 2025 year low and further retrace losses from the 2021 year high to .7210, 61.8% Fibonacci retracement. Meanwhile, support at the .7100 level should underpin. Below this will open up room for deeper pullback and see consolidation to the .7050/.7000 area.