Published: 2025-02-18T14:14:00.000Z
Chart USD Index DXY Update: Limited gains - background studies remain under pressure

Senior Technical Strategist
-
Little change, as prices extend consolidation beneath resistance at 107.00
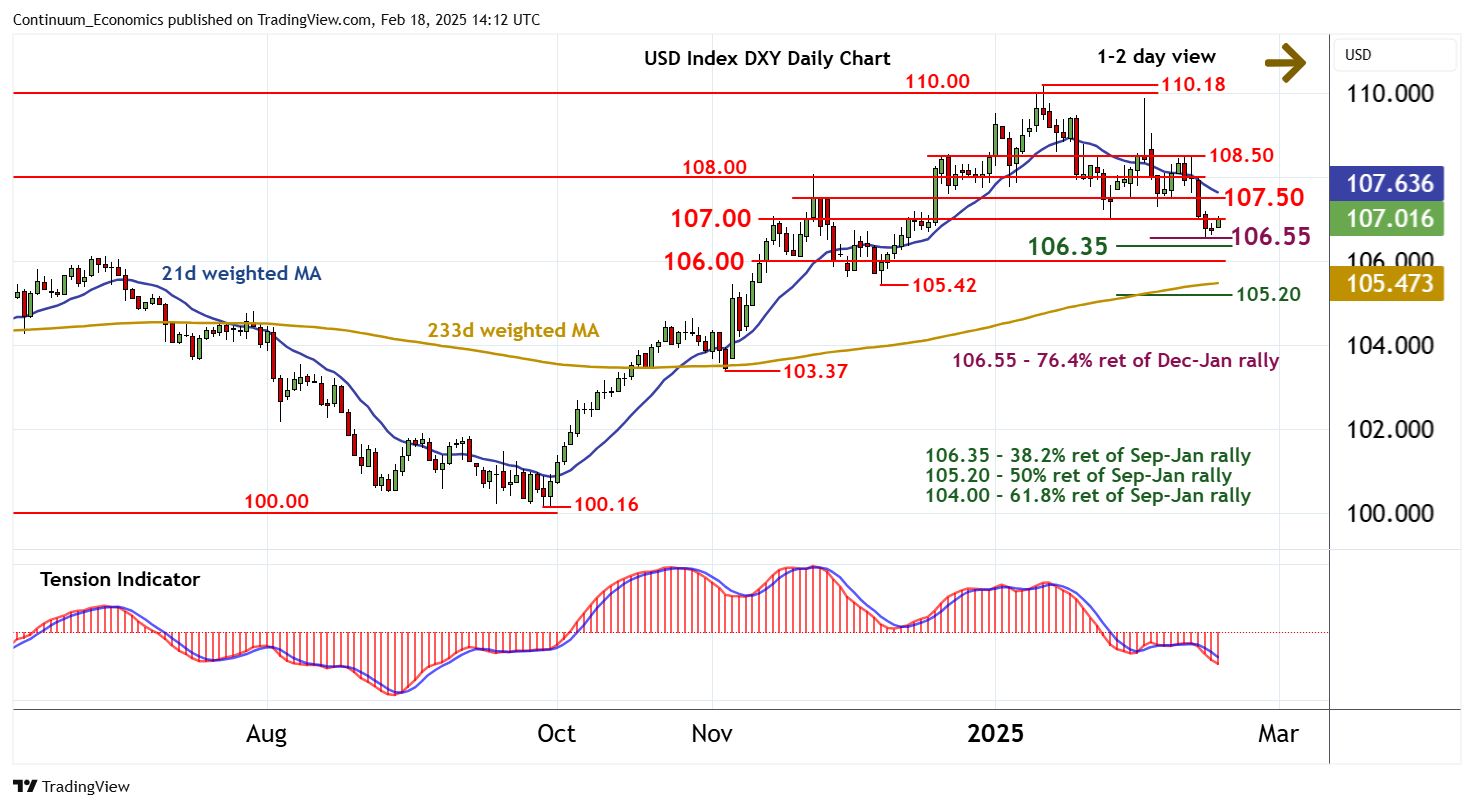
| Levels | Imp | Comment | Levels | Imp | Comment | |||
|---|---|---|---|---|---|---|---|---|
| R4 | 108.50 | minor break level | S1 | 106.55 | ** | 76.4% ret of Dec-Jan rally | ||
| R3 | 108.00 | break level | S2 | 106.35 | ** | 38.2% ret of Sep-Jan rally | ||
| R2 | 107.50 | * | congestion | S3 | 106.00 | ** | congestion | |
| R1 | 107.00 | ** | break level | S4 | 105.42 | ** | 6 Dec (m) low |
Asterisk denotes strength of level
13:55 GMT - Little change, as prices extend consolidation beneath resistance at 107.00. Intraday studies are edging higher and oversold daily stochastics are flattening, suggesting potential for a test above here. But the negative daily Tension Indicator and bearish weekly charts are expected to limit scope in renewed selling interest beneath congestion around 107.50. Following corrective/cautious trade, fresh losses are looked for. A later break below support at the 106.55 Fibonacci retracement will extend January losses towards the 106.35 Fibonacci retracement, ahead of congestion around 106.00.