Published: 2026-04-09T08:09:43.000Z
Chart USD Index DXY Update: Cautious trade
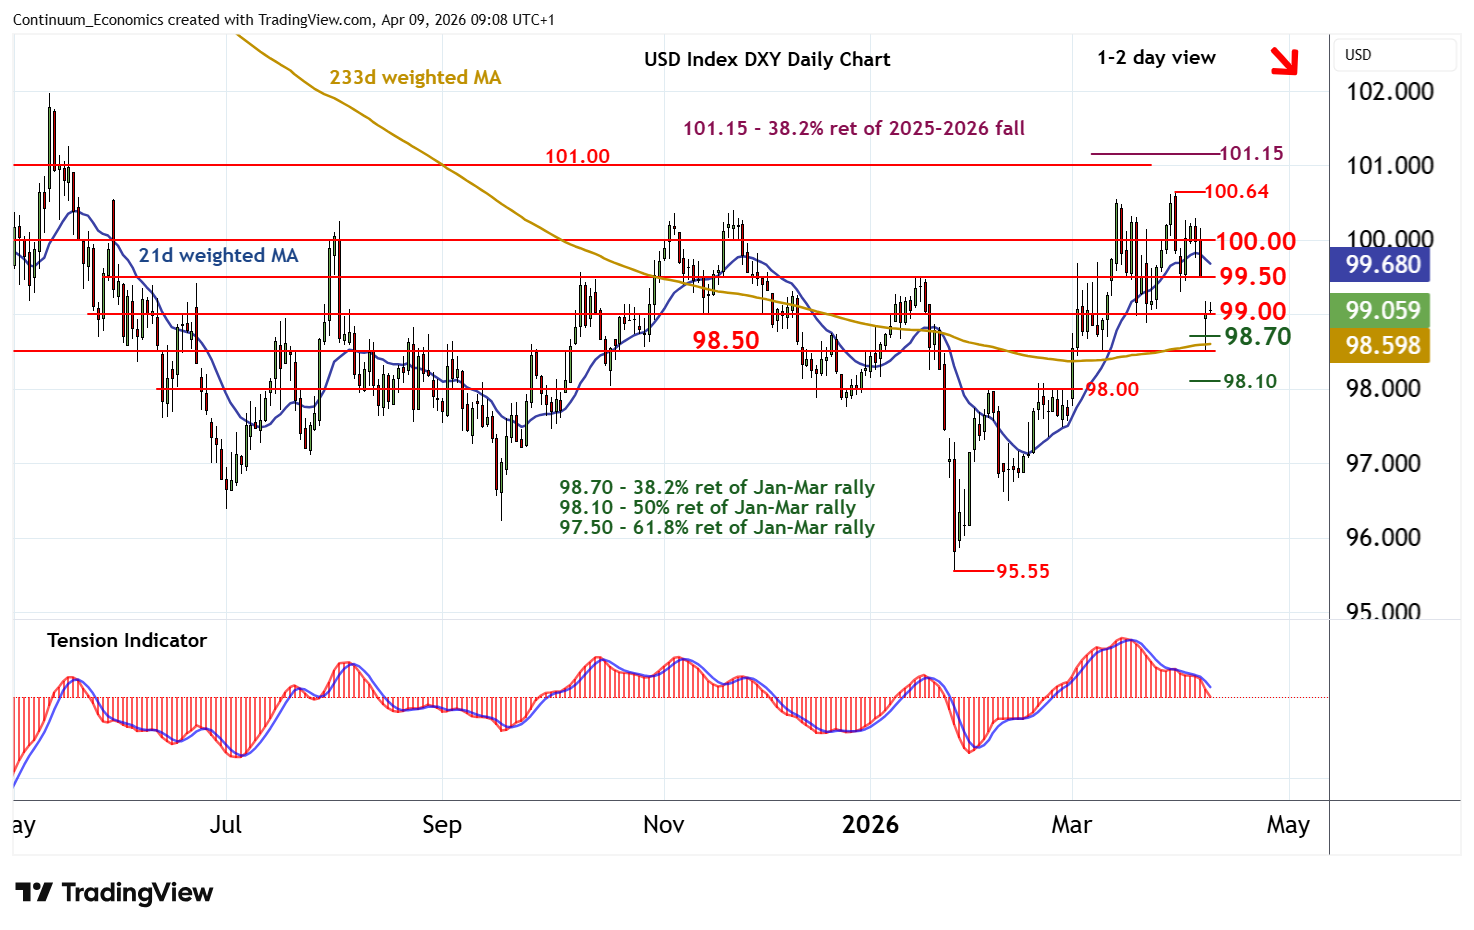
2
Sharp losses have bounced from just above congestion support at 98.50
| Levels | Imp | Comment | Levels | Imp | Comment | |||
|---|---|---|---|---|---|---|---|---|
| R4 | 100.30 | congestion highs | S1 | 99.00 | ** | congestion | ||
| R3 | 100.00 | ** | congestion | S2 | 98.70 | ** | 38.2% ret of Jan-Mar rally | |
| R2 | 99.50 | * | congestion | S3 | 98.50 | * | congestion | |
| R1 | 99.18 | 8 Apr high | S4 | 98.00/10 | ** | congestion; 50% ret |
Asterisk denotes strength of level
08:55 BST - Sharp losses have bounced from just above congestion support at 98.50, with prices currently balanced in cautious trade above 99.00. Rising intraday studies highlight room for a test above the 99.18 high of 8 April. But negative daily readings and unwinding overbought weekly stochastics should limit scope in renewed selling interest towards congestion resistance at 99.50. Following cautious trade, fresh losses are looked for. However, a close below the 98.70 Fibonacci retracement is needed to add weight to sentiment and extend late-March losses below 98.50 towards 98.00/10.