Published: 2025-04-03T11:01:51.000Z
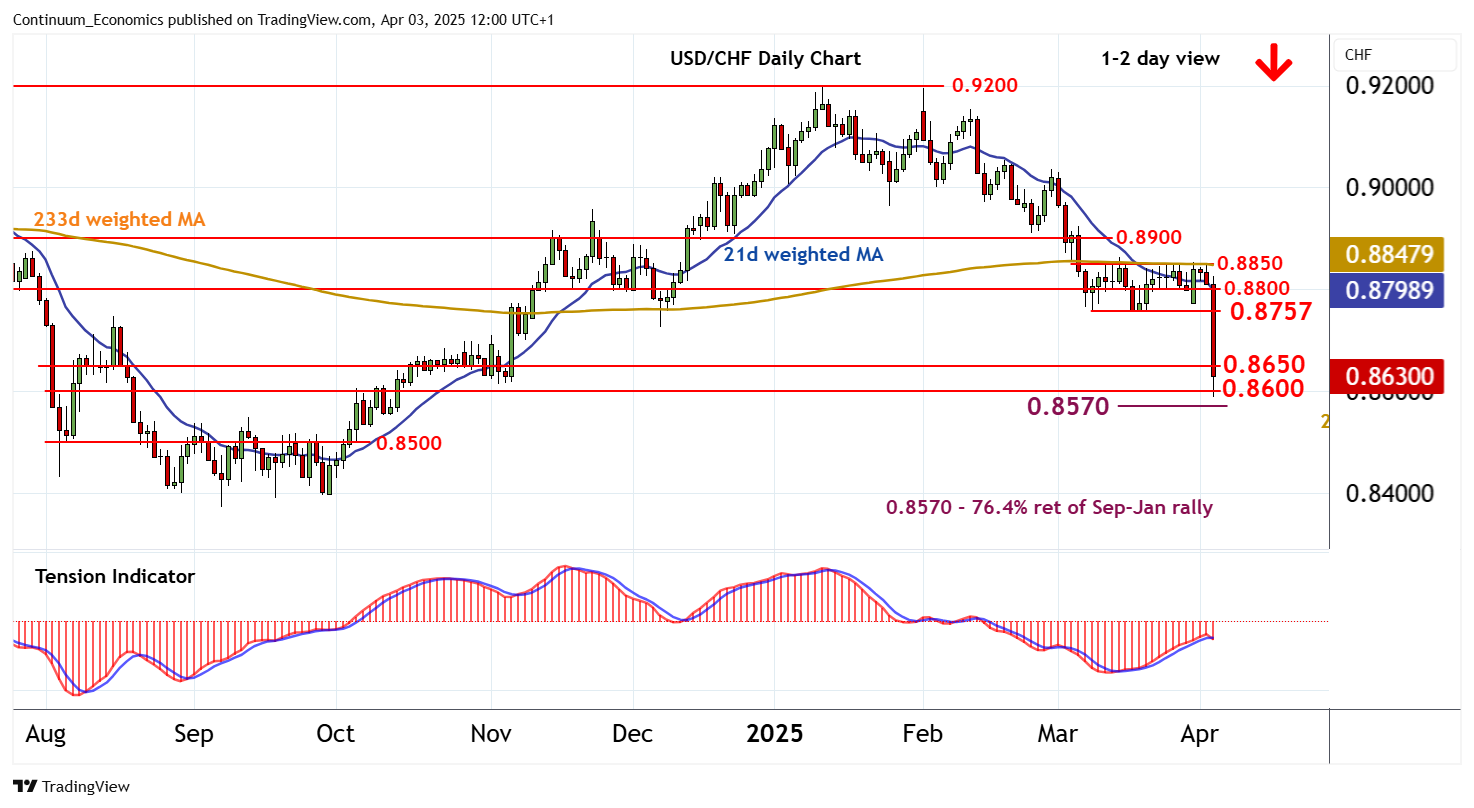
Chart USD/CHF Update: Extending January losses

Senior Technical Strategist
-

Anticipated losses have extended, with the break below 0.8650 reaching congestion support at 0.8600

| Level | Comment | Level | Comment | |||||
|---|---|---|---|---|---|---|---|---|
| R4 | 0.8850 | * | March range highs | S1 | 0.8600 | * | congestion | |
| R3 | 0.8800 | ** | congestion | S2 | 0.8570 | ** | 76.4% ret of Sep-Jan rally | |
| R2 | 0.8757 | ** | 10 Mar (m) low | S3 | 0.8500 | ** | congestion | |
| R1 | 0.8650 | ** | congestion | S4 | 0.8450 | * | congestion |
Asterisk denotes strength of level
11:55 BST - Anticipated losses have extended, with the break below 0.8650 reaching congestion support at 0.8600. A minor bounce is developing from here, as oversold intraday studies flatten. But negative daily and weekly readings are expected to keep prices under pressure, with room for a later break back beneath here towards the 0.8570 Fibonacci retracement. Meanwhile, any break above congestion resistance at 0.8650 should meet renewed selling interest beneath the 0.8757 monthly low of 10 March.