Published: 2025-10-20T08:07:27.000Z
Chart USD/JPY Update: Cautious trade
-
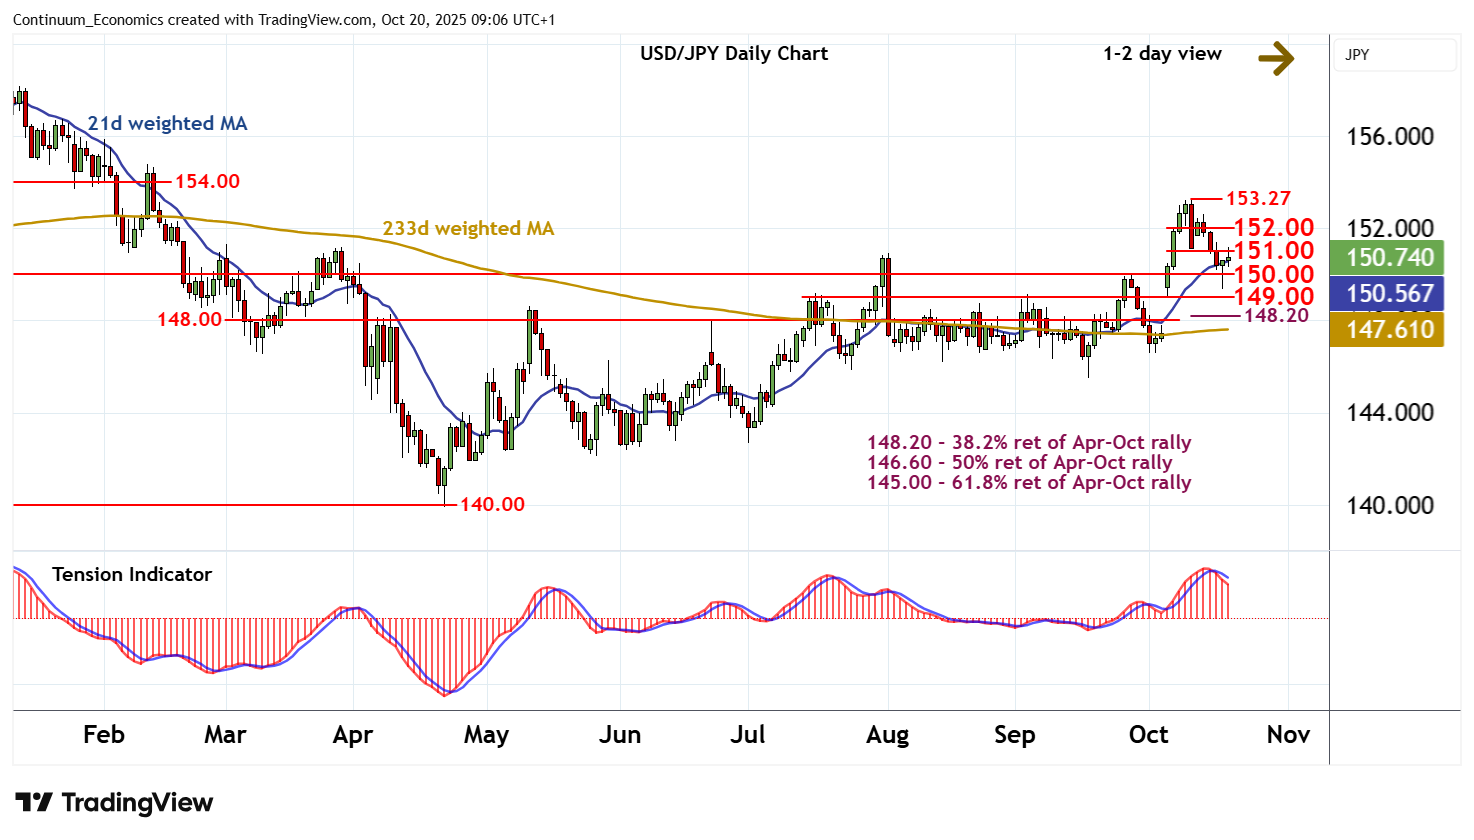
The bounce from the 149.37 weekly low of 17 October has reached resistance at 151.00
| Levels | Imp | Comment | Levels | Imp | Comment | |||
|---|---|---|---|---|---|---|---|---|
| R4 | 154.00 | ** | congestion | S1 | 150.00 | ** | congestion | |
| R3 | 153.27 | ** | 10 Oct YTD high | S2 | 149.37 | 17 Oct (w) low | ||
| R2 | 152.00 | congestion | S3 | 149.00 | * | congestion | ||
| R1 | 151.00 | break level | S4 | 148.00/20 | * | break level; 38.2% ret |
Asterisk denotes strength of level
08:55 BST - The bounce from the 149.37 weekly low of 17 October has reached resistance at 151.00, where mixed intraday studies are prompting a pullback to 150.75. Daily readings are under pressure, suggesting potential for a move back down to congestion support at 150.00. But rising weekly charts should limit any break in renewed buying interest above congestion support at 149.00. Meanwhile, a close above 151.00 would help to improve sentiment and open up a test of congestion resistance at 152.00.