Chart EUR/JPY Update: Sharp pullback in JPY-driven trade
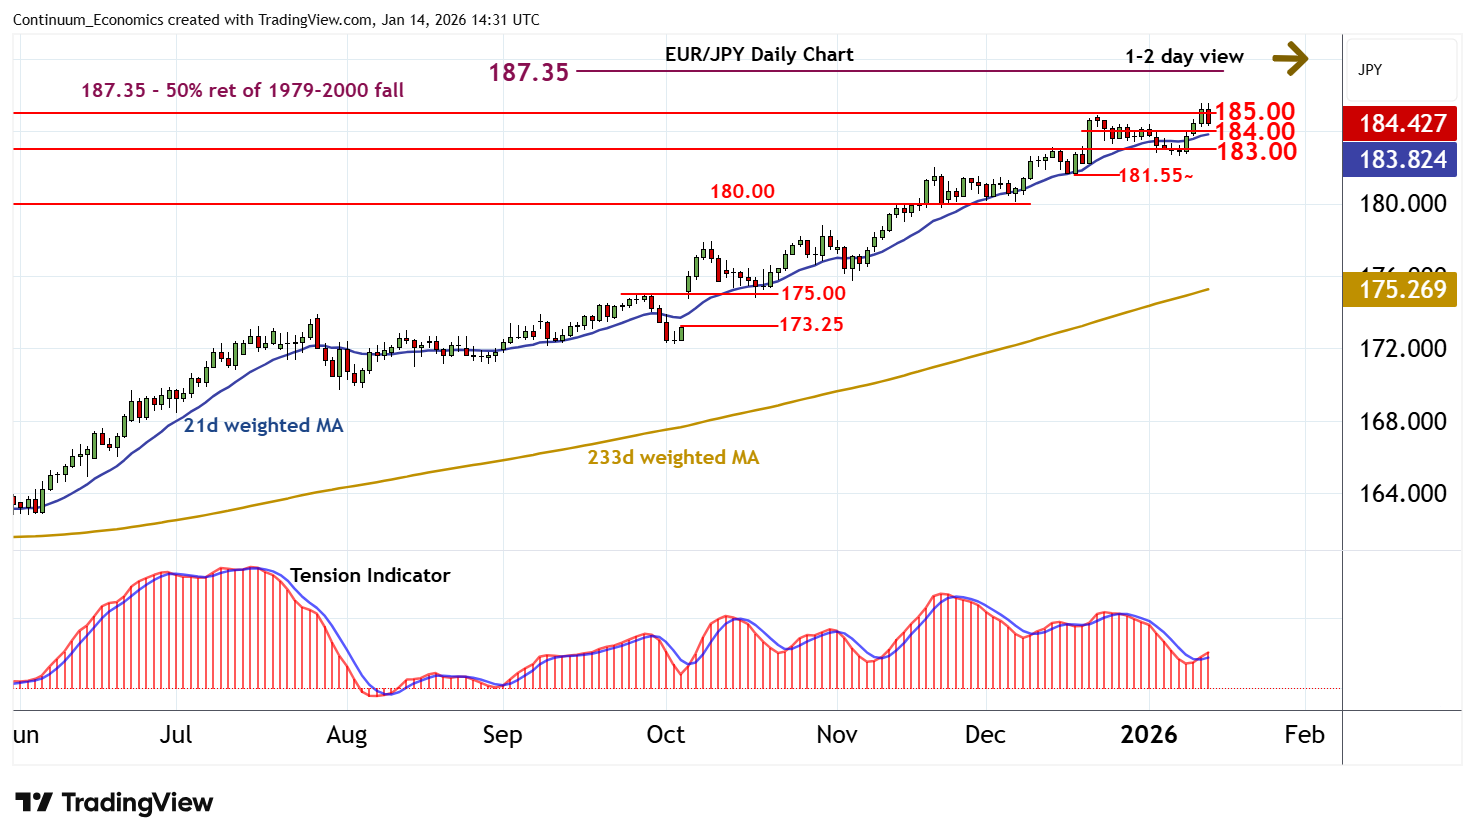
Prices have posted a fresh multi-decade high around 185.55~
| Levels | Imp | Comment | Levels | Imp | Comment | |||
|---|---|---|---|---|---|---|---|---|
| R4 | 187.35 | ** | 50% ret of 1979-2000 fall | S1 | 184.00 | * | congestion | |
| R3 | 186.00 | * | figure | S2 | 183.00 | * | break level | |
| R2 | 185.55~ | fresh YTD high | S3 | 182.00 | * | break level | ||
| R1 | 185.00 | * | break level | S4 | 181.55~ | ** | 17 Dec (w) low |
Asterisk denotes strength of level
14:15 GMT - Prices have posted a fresh multi-decade high around 185.55~, before falling sharply in JPY-driven trade to currently trade around 184.50. Negative intraday studies highlight room for a test of congestion support at 184.00. But rising daily readings are expected to limit any initial tests in consolidation, before deteriorating weekly charts prompt further losses. A close below 183.00, if seen, would add weight to sentiment and signal a near-term top in place, as increased selling interest then focuses initially on the 181.55~ weekly low of 17 December. Meanwhile, a close back above 185.00 would improve price action and extend long-term gains towards strong resistance at the 187.35 multi-decade Fibonacci retracement. Deteriorating weekly charts could prompt significant selling interest towards here.