Continuum Economics
  • Search
  • About Us
  • Buy
  • Invite A Friend
  • My Basket
  • Articles
  • Calendar
  • Forecasts
  • Events
  • Data
  • Newsletters
  • My Alerts
  • Community
  • Directory
  • About Us
  • Buy
  • Invite A Friend
  • My Basket
  • Articles
    • All
    • Thematic
    • Tactical
    • Asia
    • EMEA
    • Americas
    • Newsletters
    • Freemium
    • Editor's Choice
    • Most Viewed
    • Most Shared
    • Most Liked
  • Calendar
    • Interactive
      • China
      • United States
      • Eurozone
      • United Kingdom
    • Month Ahead
    • Reviews
    • Previews
  • Forecasts
    • Forecasts
    • Key Views
  • Events
    • Media
    • Conference Calls
  • Data
    • Country Insights
    • Shadow Credit Ratings
    • Full CI Data Download
  • Newsletters
  • My Alerts
  • Community
    • FX
    • Fixed Income
    • Macro Strategy
    • Credit Markets
    • Equities
    • Commodities
    • Precious Metals
    • Renewables
  • Directory
  • My Account
  • Notifications Setup
  • Administration Panel
  • Account Details
  • Recent Devices
  • Distribution Lists
  • Shared Free Trials
  • Saved Articles
  • Shared Alerts
  • My Posts
Published: 2025-12-11T06:47:54.000Z

Chartbook: U.S. Chart S&P 500: Poised for further gains in the new year

-

Rebound from November pullback low above the 6500 level see pressure returning to the 6920, October record high

Rebound from November pullback low above the 6500 level see pressure returning to the 6920, October record high. The underlying bull trend suggest scope for break here to extend the rally from 4835 April current year low.

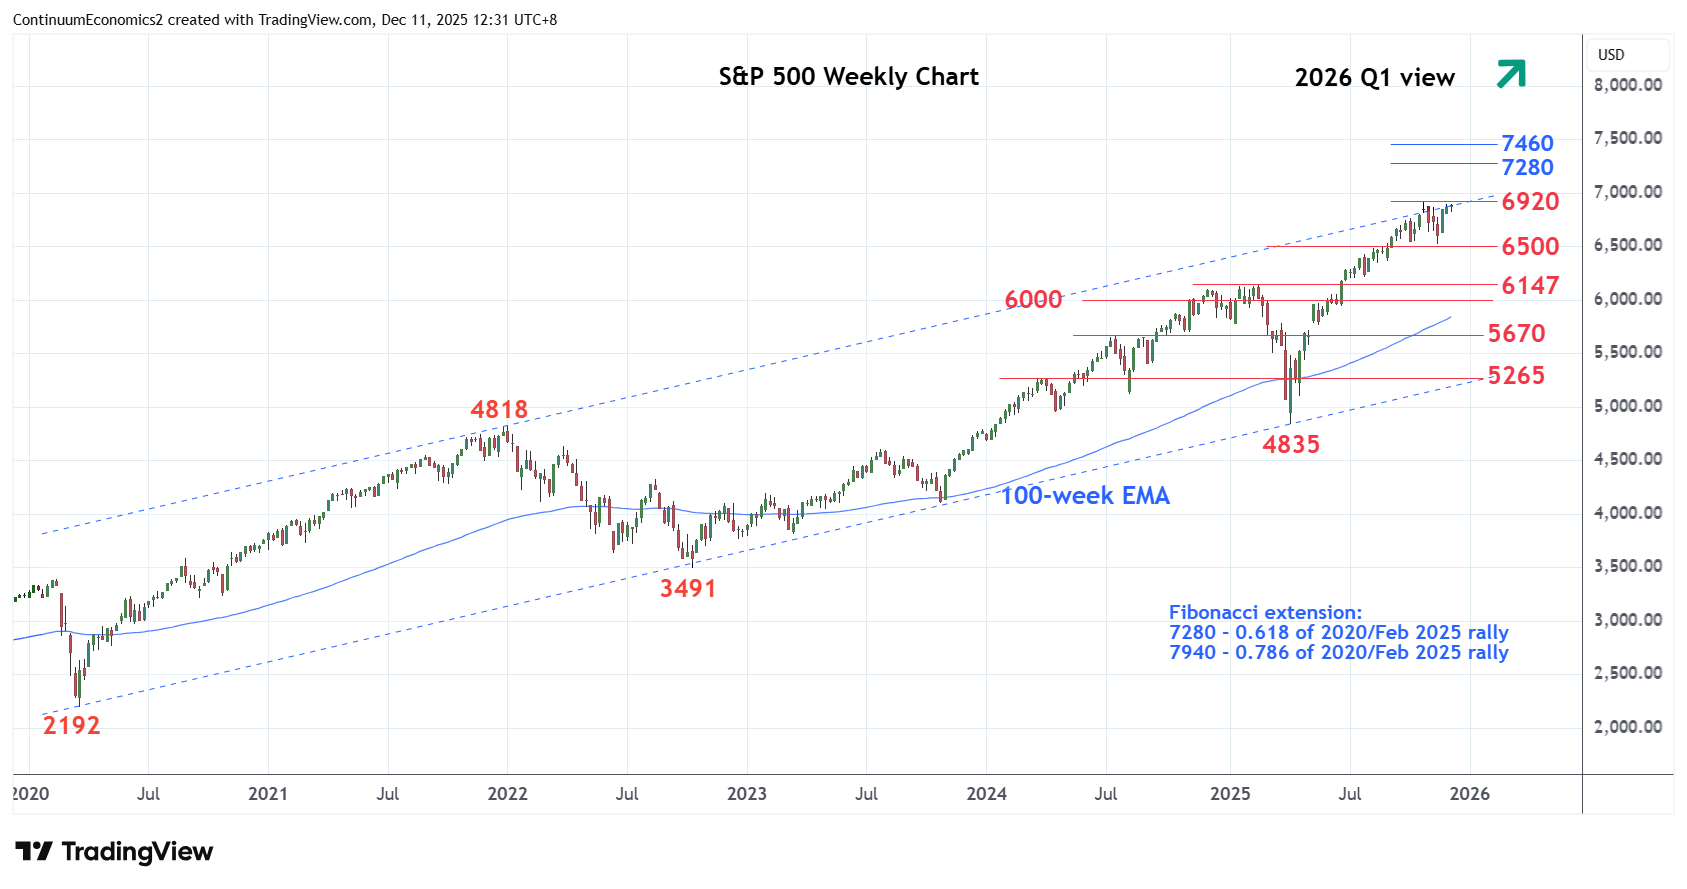
Break here will see room to target the 7000 figure. Above this will see room for extension to target 7280, the 61.8% Fibonacci extension of 2020/February 2025 rally. Higher still, will see scope to 7460, being equality projection of the February/April corrective pullback following the June break to fresh high. However, deep overbought weekly and monthly studies caution corrective pullback.

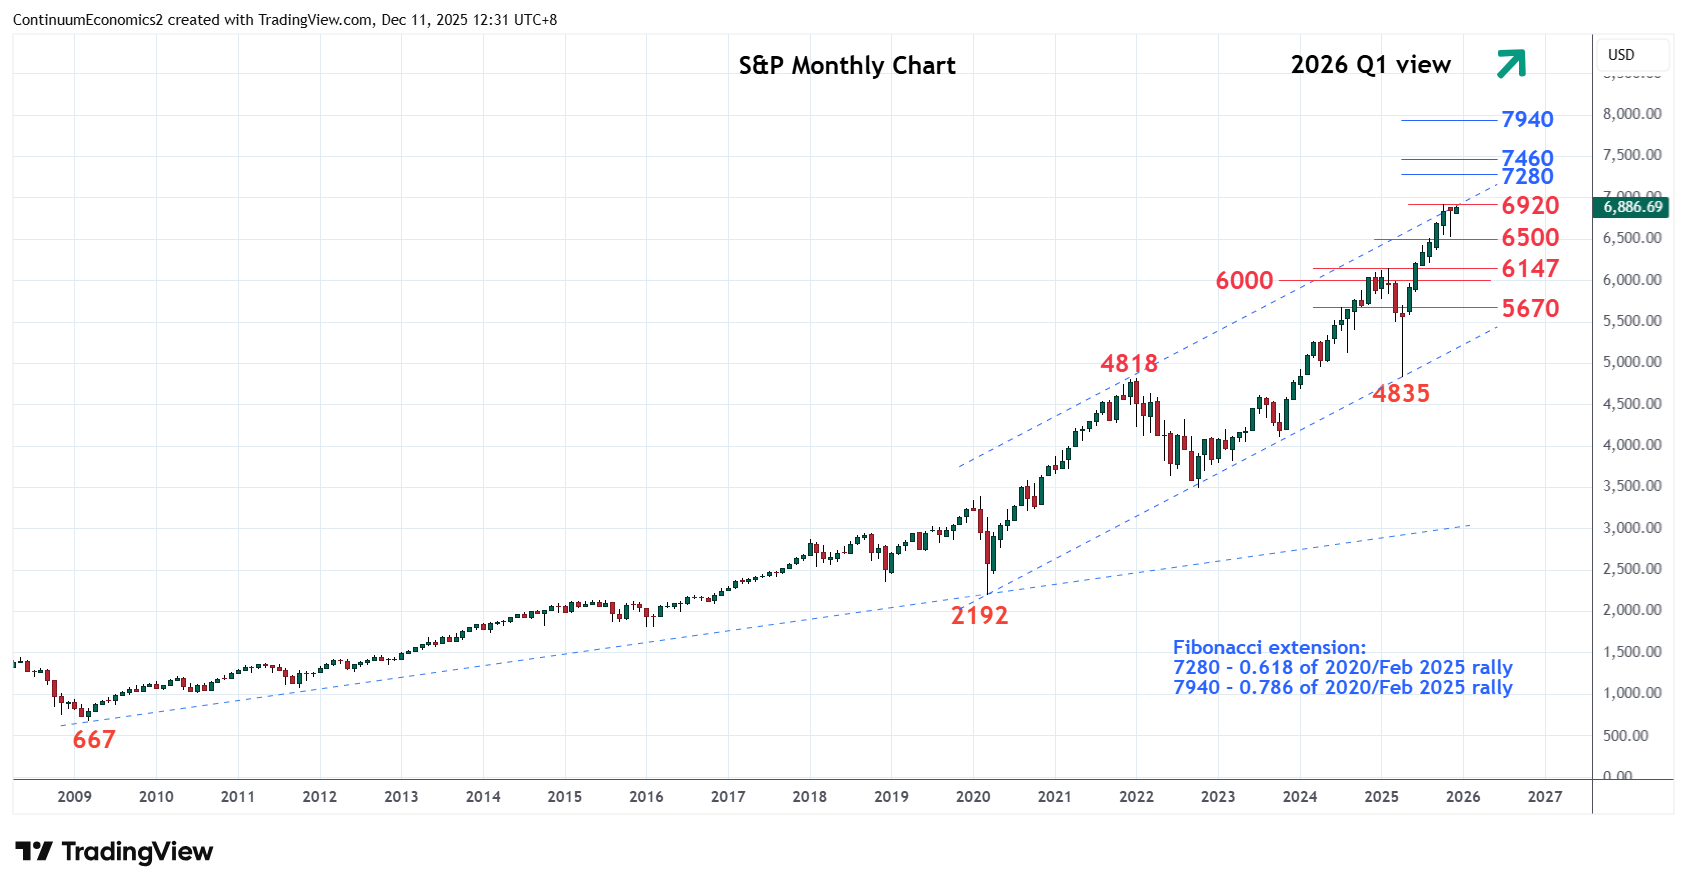
Would take break of support at the 6500 level to open up room for deeper corrective pullback to the strong support at the 6147/6000, January high and psychological level. Break below this area will see room to extend losses to the 5670/5500 support area, a 20% correction from the October high. Lower still, if seen, will see deeper pullback to support at the 5670/5600 area and channel support from the March 2020 year low.

Continue to read the article for free
Login

or

or

Topics
US S&P Comp.-TA
Technical Analysis
ChartBook

GENERAL

  • Home
  • About Us
  • Our Team
  • Careers

LEGAL

  • Terms and Conditions
  • Privacy Policy
  • Compliance
  • GDPR

GET IN TOUCH

  • Contact Us
Continuum Economics
The Technical Analyst Awards Winner 2021
The Technical Analyst Awards Finalist 2020
image