Published: 2026-05-04T01:30:36.000Z
Chart EUR/JPY Update: Consolidating sharp losses last week
8
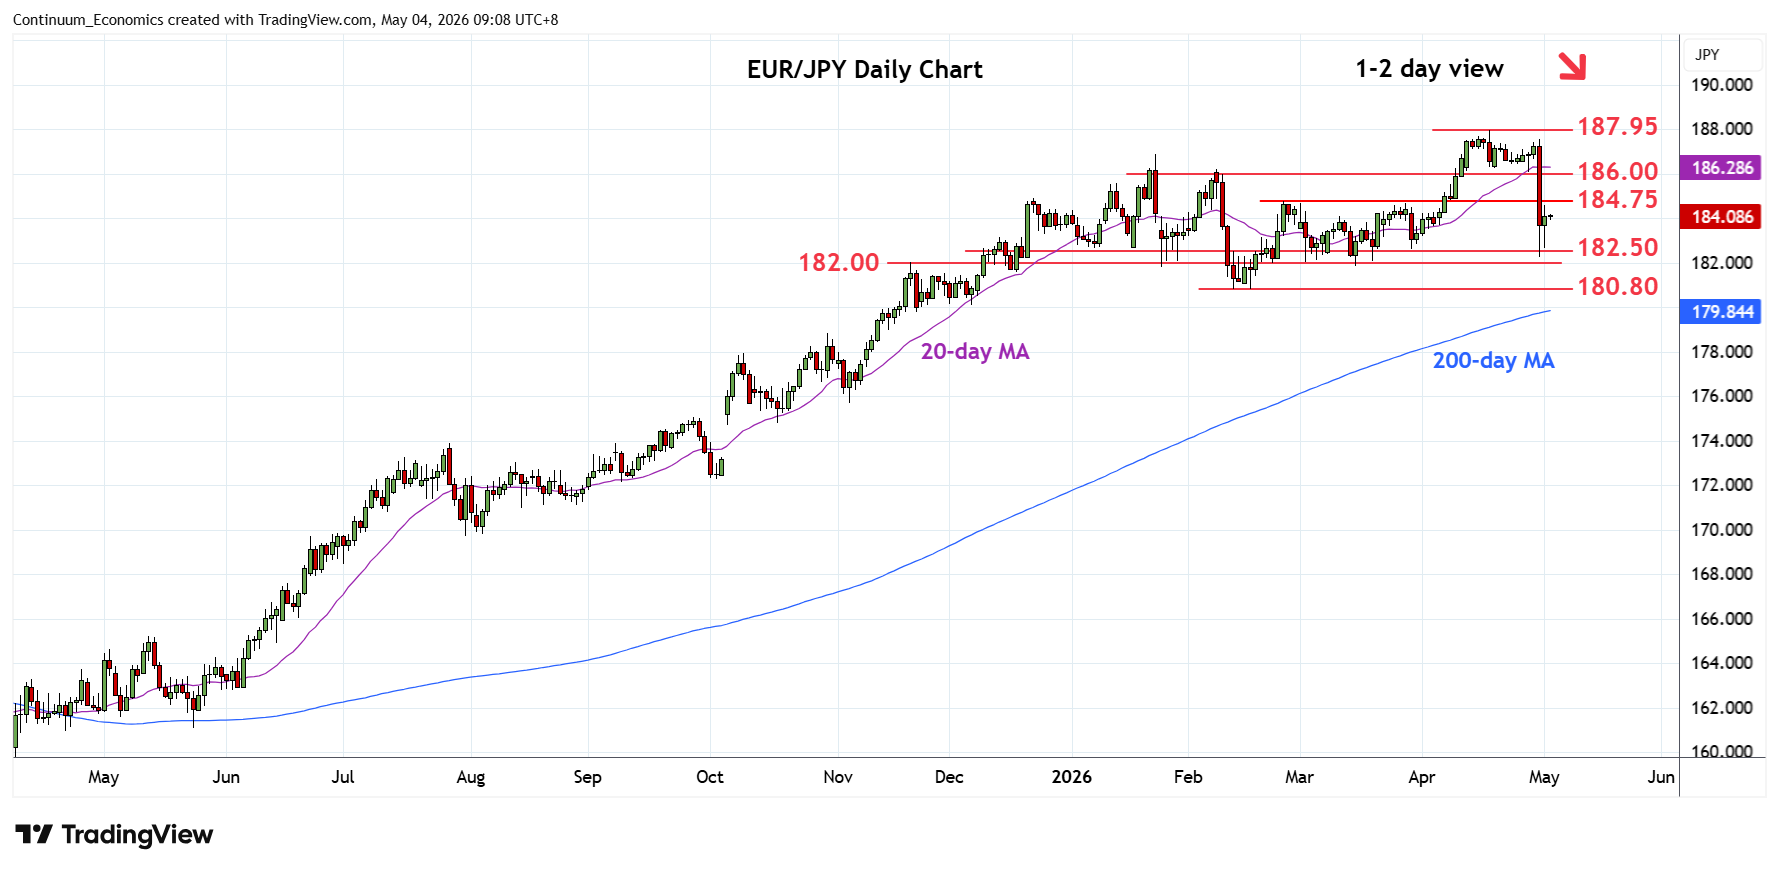
Turned up from test of support at the 182.50/182.00 congestion to consolidate sharp losses from 187.55 high of 30 April
| Levels | Imp | Comment | Levels | Imp | Comment | |||
|---|---|---|---|---|---|---|---|---|
| R4 | 186.87 | * | Jan high | S1 | 183.00 | * | congestion | |
| R3 | 186.00/23 | ** | congestion, 20 Apr low | S2 | 182.50 | * | congestion | |
| R2 | 185.00 | * | congestion | S3 | 182.00 | ** | Nov high, congestion | |
| R1 | 184.50/75 | ** | congestion, 25 Feb high | S4 | 180.80 | ** | 12 Feb YTD low |
Asterisk denotes strength of level
01:20 GMT - Turned up from test of support at the 182.50/182.00 congestion to consolidate sharp losses from 187.55 high of 30 April. Consolidation around the 184.00 level is expected to give way to fresh selling pressure later to retest the 182.50/182.00 support. Below this will turn focus to the 180.80, 12 February current year low. Below this will see deeper pullback to retrace gains from the February 2025 year low. Meanwhile, resistance at the 184.50/75 congestion and 25 February low is expected to cap bounce attempt.