Published: 2026-05-12T07:03:39.000Z
Chart AUD/NZD Update: Room for deeper pullback from April high
3
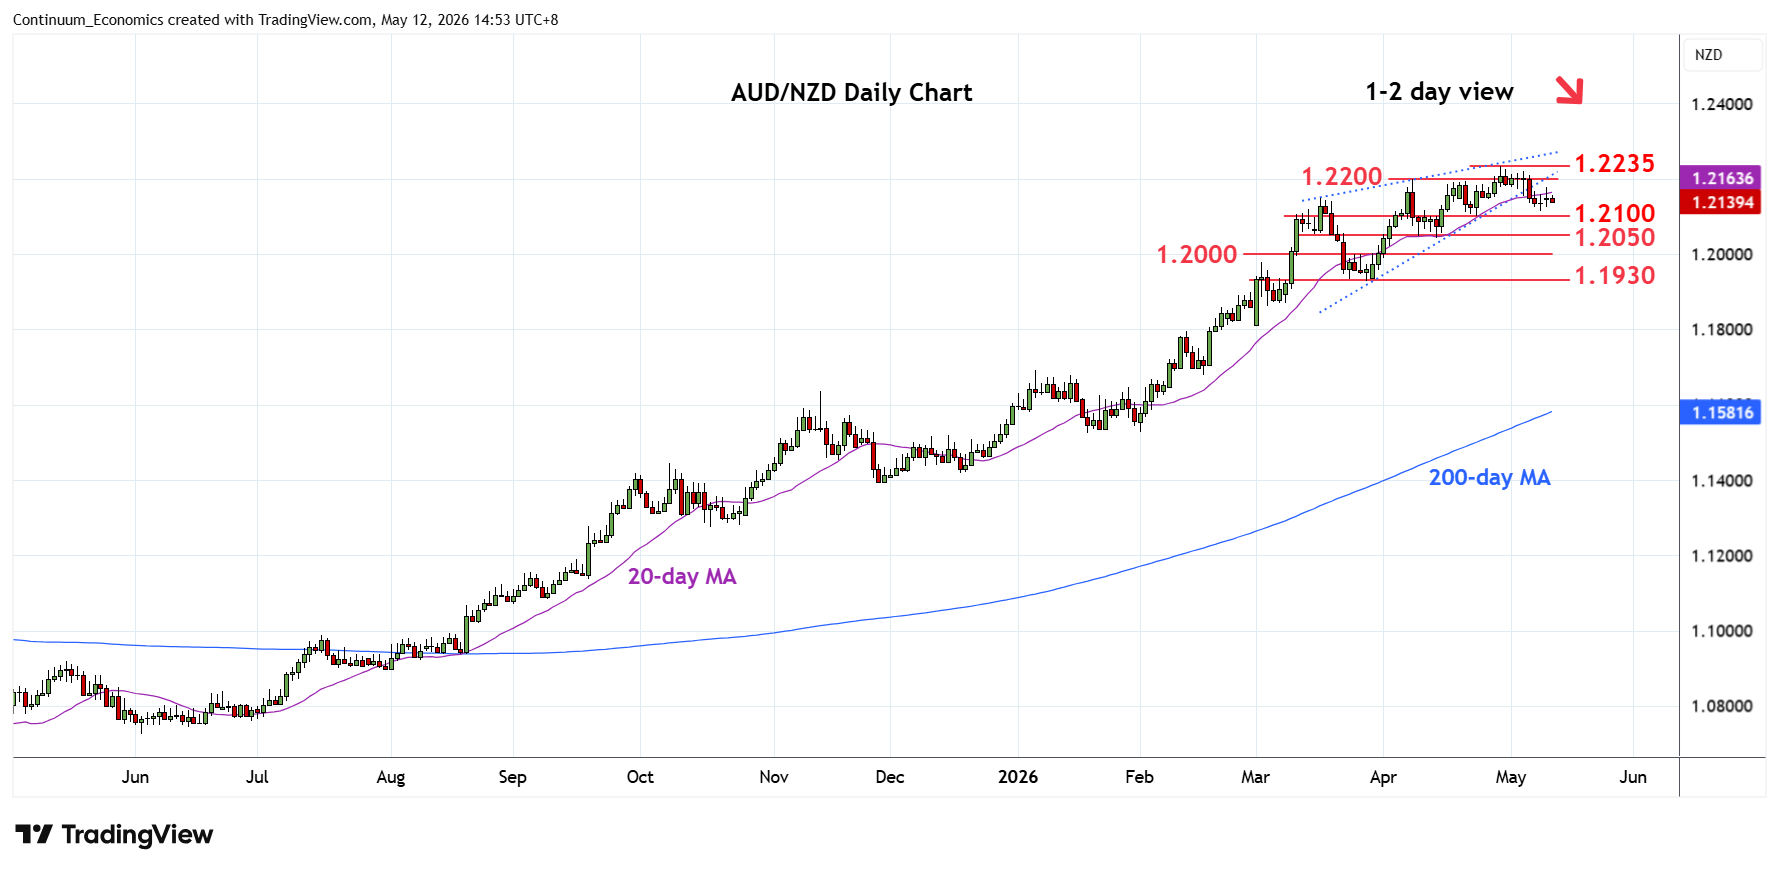
Edged up from the 1.2115 low of last week as prices consolidate losses from the 1.2235 April current year high
| Level | Comment | Level | Comment | |||||
|---|---|---|---|---|---|---|---|---|
| R4 | 1.2300/10 | ** | congestion, 2011 yr low | S1 | 1.2100 | ** | 23 Apr low | |
| R3 | 1.2235 | ** | 29 Apr YTD high | S2 | 1.2050 | ** | congestion | |
| R2 | 1.2200 | * | 8 Apr high, congestion | S3 | 1.2000 | * | congestion | |
| R1 | 1.2150 | * | Mar high | S4 | 1.1930 | ** | 27 Mar low |
Asterisk denotes strength of level
07:00 GMT - Edged up from the 1.2115 low of last week as prices consolidate losses from the 1.2235 April current year high. Daily studies are unwinding overbought readings and suggest this giving way to renewed selling pressure and to strong support at 1.2100/1.2050, 23 April low and congestion area. Break here to open up room for deeper pullback toretrace gains from the April 2025 year low and see extension to the 1.2000 figure then the 1.1930, 27 March low. Meanwhile, resistance at the 1.2200/1.2235 congestion and April high is expected to cap.