Published: 31/03/25 at 04:30 UTC
Chart USD/CAD Update: Limited corrective gains

Senior Technical Strategist
-

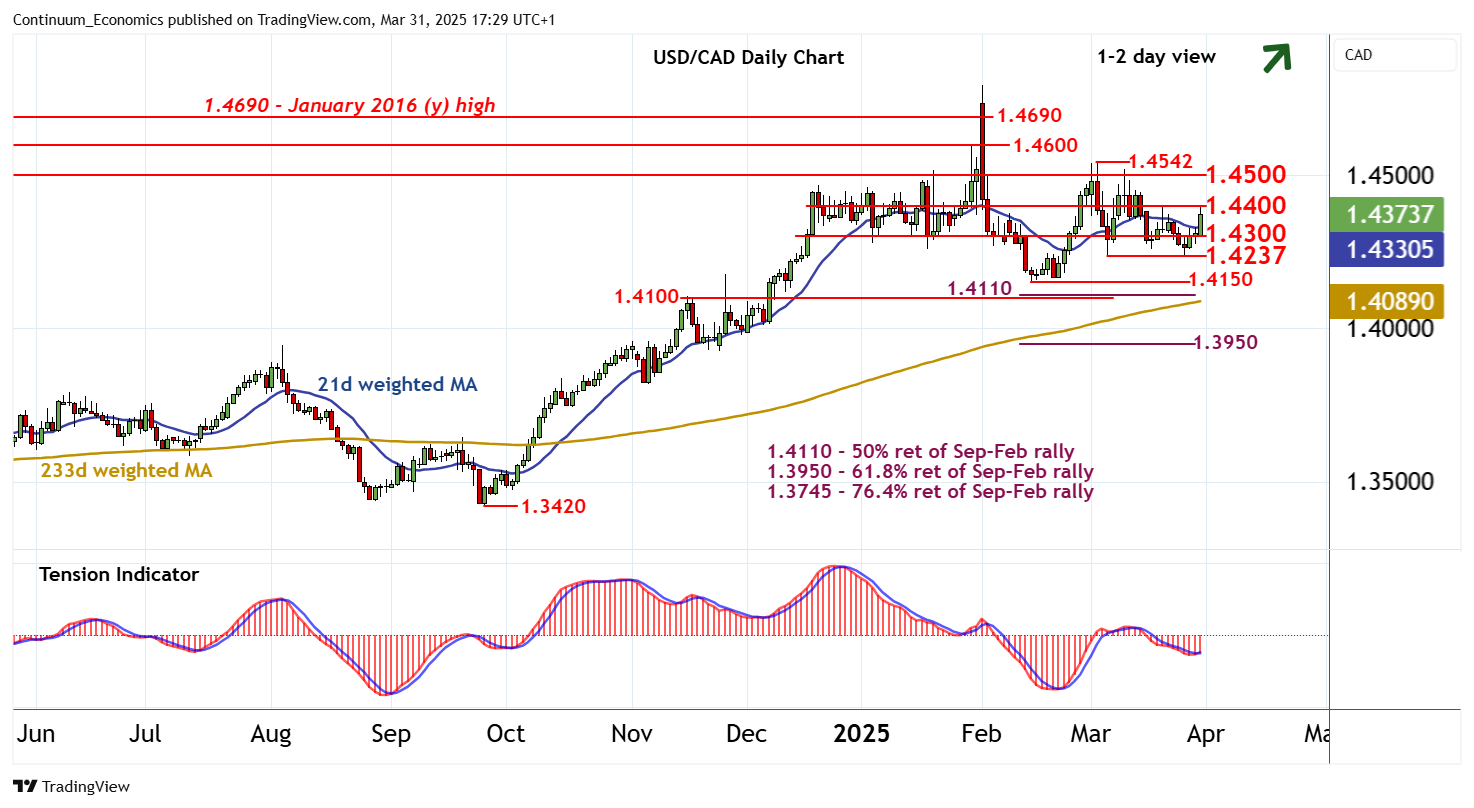
The bounce from the 1.4237 weekly low of 6 March is extending

| Levels | Imp | Comment | Levels | Imp | Comment | |||
|---|---|---|---|---|---|---|---|---|
| R4 | 1.4600 | * | break level | S1 | 1.4300 | * | break level | |
| R3 | 1.4542 | * | 4 Mar (w) high | S2 | 1.4237 | * | 6 Mar (w) low | |
| R2 | 1.4500 | ** | congestion | S3 | 1.4150 | ** | 14 Feb YTD low | |
| R1 | 1.4400 | * | break level | S4 | 1.4100/10 | ** | congestion; 50% ret |
Asterisk denotes strength of level
17:15 BST - The bounce from the 1.4237 weekly low of 6 March is extending, with prices approaching resistance at the 1.4400 break level. Overbought intraday studies could limit any initial tests in consolidation. However, daily readings are improving, highlighting room for a later break and extension corrective gains towards congestion around 1.4500. Negative weekly charts could prompt renewed selling interest towards here. Meanwhile, support is at 1.4300. But a close below 1.4237 would add weight to sentiment and extend March losses towards critical support at the 1.4150 current year low of 14 February.