Chart USD/ZAR Update: Extending April 2025 losses
Consolidation has given way to anticipated losses
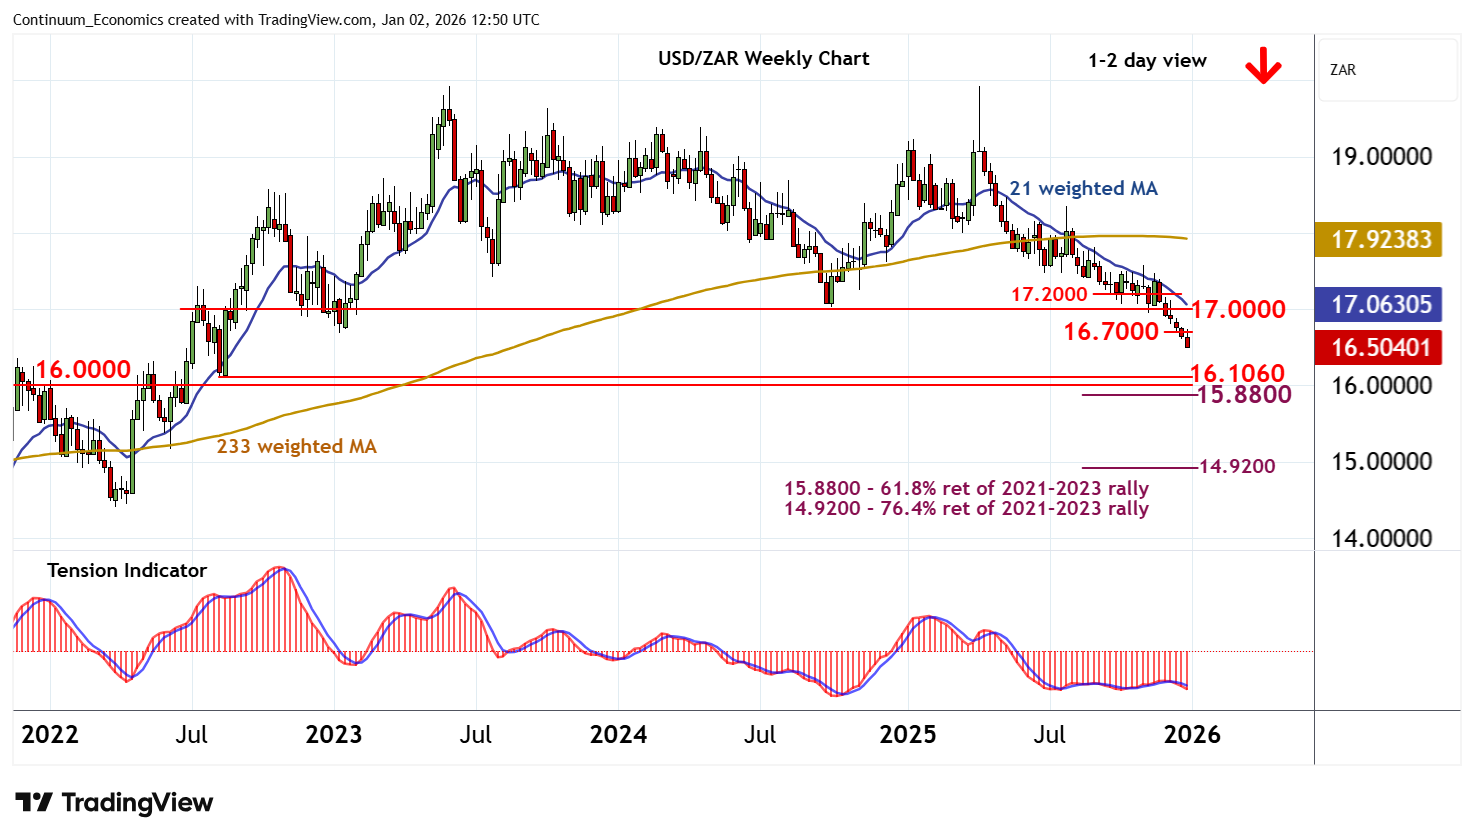
| Level | Comment | Level | Comment | |||||
|---|---|---|---|---|---|---|---|---|
| R4 | 17.2000 | * | congestion | S1 | 16.3450 | 16 Aug 2022 low | ||
| R3 | 17.0000 | ** | congestion | S2 | 16.1060 | ** | 11 Aug 2022 (m) low | |
| R2 | 16.8000 | break level | S3 | 16.0000 | ** | congestion | ||
| R1 | 16.7000 | break level | S4 | 15.8800 | ** | 61.8% ret of 2021-2023 rally |
Asterisk denotes strength of level
12:30 GMT - Consolidation has given way to anticipated losses, with prices currently trading around 16.5100. Daily readings are under pressure and both weekly and longer-term charts are also negative, highlighting room for continuation of April 2025 losses in the coming sessions. Focus is on the 16.3450 low of 16 August 2022, ahead of stronger support at the 16.1060 monthly low of 11 August 2022 and historic congestion around 16.0000. Just lower is the 15.8800 Fibonacci retracement. But flat oversold weekly stochastics are expected to limit any initial tests of this broad 15.8800 - 16.1060 range in short-covering/consolidation. Meanwhile, resistance is lowered to 16.7000. A close above here, if seen, will help to stabilise price action and prompt consolidation beneath congestion around 17.0000.